

Question: pls ans them 9. In the above figure, curve A is the cost curve and curve B is the cost curve. a. total variable; total
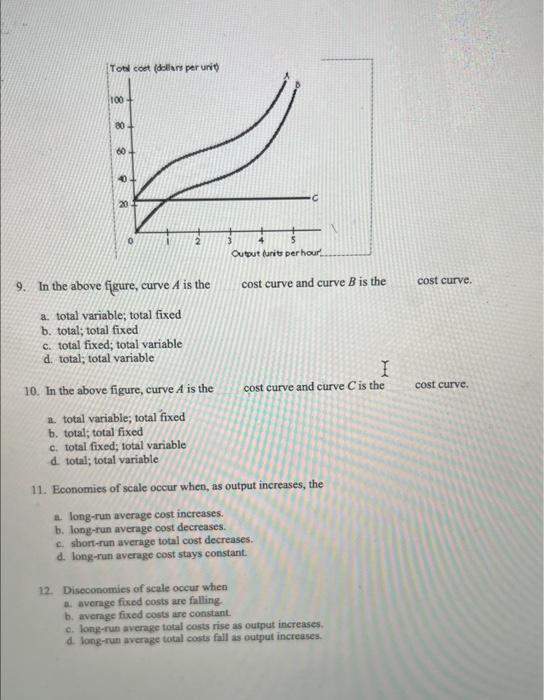

9. In the above figure, curve A is the cost curve and curve B is the cost curve. a. total variable; total fixed b. total; total fixed c. total fixed; total variable d. total; total variable 10. In the above figure, curve A is the cost curve and curve C is the cost curve. a. total variable; total fixed b. total; total fixed c. total fixed; total variable d. total; total variable 11. Economies of scale occur when, as output inereases, the a. long-run average cost increases. b. long-run average cost decreases. c. short-run average total cost decreases. d. long-run average cost stays constant. 12. Diseconomies of seale oceur when a. average fived costs are falling b. avenge fixed costs are constant. c. long-run average total costs rise as output increases. d. long-run avcrage total costs fail as output increases
Step by Step Solution
There are 3 Steps involved in it

Get step-by-step solutions from verified subject matter experts