

Question: pls answer this questions Consider the following multiple regression model for a sample of 209 firms in Country XYZ for 2018 Salary, = B. +
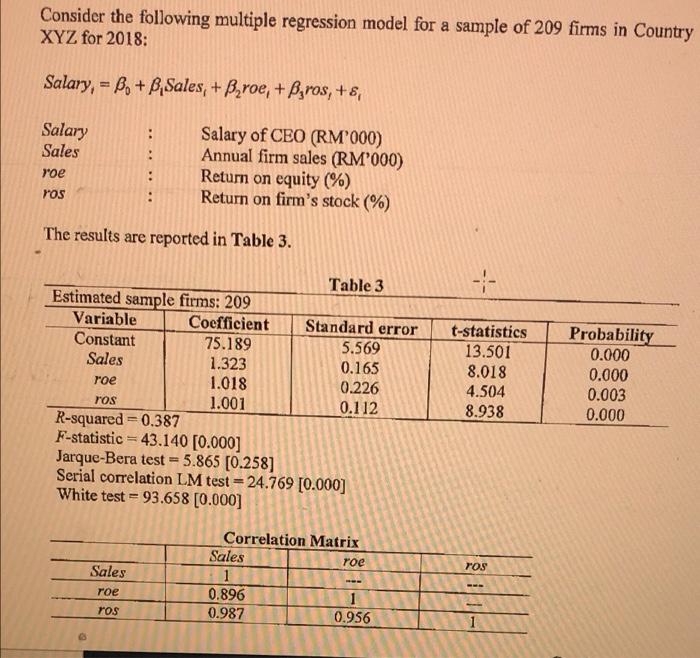
Consider the following multiple regression model for a sample of 209 firms in Country XYZ for 2018 Salary, = B. + B Sales, + B roe, + Byros, +8, Salary Sales Salary of CEO (RM'000) Annual firm sales (RM'000) Return on equity (%) Return on firm's stock (%) : : : roe YOS The results are reported in Table 3. Table 3 Estimated sample firms: 209 Variable Coefficient Standard error Constant 75.189 5.569 Sales 1.323 0.165 roe 1.018 0.226 ros 1.001 0.112 R-squared=0.387 F-statistic = 43.140 [0.000] Jarque-Bera test - 5.865 [0.258] Serial correlation LM test = 24.769 [0.000] White test = 93.658 [0.000] t-statistics 13.501 8.018 4.504 8.938 Probability 0.000 0.000 0.003 0.000 Sales ros Correlation Matrix Sales roe 1 0.896 1 0.987 0.956 roe ros 1 Based on Table 3, answer the following questions: (a) Do all the explanatory variables significantly explain the salary of CEO? Explain using F-test at a = 5%. (5 marks) (b) Calculate and interpret the elasticity of CEO's salary with respect to the annual firm sales, given that the salary of CEO (RM'000) is 150 and annual firm sales (RM'000) are 850. (6 marks) (c) Has the estimated multiple regression model met the assumptions underlying the method of Ordinary Least Square (OLS)? Explain your answer based on c= 5%. (8 marks) Generate a 95% prediction interval for the salary of a CEO in a company, given Sales = 500, roe - 11.82, ros = 5.35, and the estimated standard error = 0.864. (4 marks) (d) Is the forecast likely to be accurate? Explain based on part (c). (2 marks) Consider the following multiple regression model for a sample of 209 firms in Country XYZ for 2018 Salary, = B. + B Sales, + B roe, + Byros, +8, Salary Sales Salary of CEO (RM'000) Annual firm sales (RM'000) Return on equity (%) Return on firm's stock (%) : : : roe YOS The results are reported in Table 3. Table 3 Estimated sample firms: 209 Variable Coefficient Standard error Constant 75.189 5.569 Sales 1.323 0.165 roe 1.018 0.226 ros 1.001 0.112 R-squared=0.387 F-statistic = 43.140 [0.000] Jarque-Bera test - 5.865 [0.258] Serial correlation LM test = 24.769 [0.000] White test = 93.658 [0.000] t-statistics 13.501 8.018 4.504 8.938 Probability 0.000 0.000 0.003 0.000 Sales ros Correlation Matrix Sales roe 1 0.896 1 0.987 0.956 roe ros 1 Based on Table 3, answer the following questions: (a) Do all the explanatory variables significantly explain the salary of CEO? Explain using F-test at a = 5%. (5 marks) (b) Calculate and interpret the elasticity of CEO's salary with respect to the annual firm sales, given that the salary of CEO (RM'000) is 150 and annual firm sales (RM'000) are 850. (6 marks) (c) Has the estimated multiple regression model met the assumptions underlying the method of Ordinary Least Square (OLS)? Explain your answer based on c= 5%. (8 marks) Generate a 95% prediction interval for the salary of a CEO in a company, given Sales = 500, roe - 11.82, ros = 5.35, and the estimated standard error = 0.864. (4 marks) (d) Is the forecast likely to be accurate? Explain based on part (c). (2 marks)
Step by Step Solution
There are 3 Steps involved in it

Get step-by-step solutions from verified subject matter experts