

Question: Pls find the upper and lower control limits! Pls show work and will give like! The defect rate for your product has historically been about
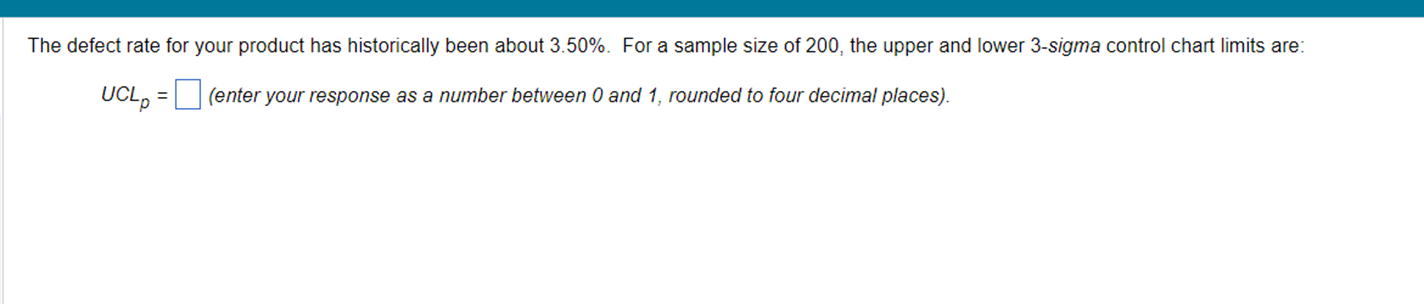 Pls find the upper and lower control limits! Pls show work and will give like!
Step by Step Solution
There are 3 Steps involved in it
1 Expert Approved Answer
Step: 1 Unlock

Question Has Been Solved by an Expert!
Get step-by-step solutions from verified subject matter experts
Step: 2 Unlock
Step: 3 Unlock