

Question: pls give full solution for learning purpose A disk drive manufacturer has monitored number of defective parts coming out from its manufacturing line as a
pls give full solution for learning purpose
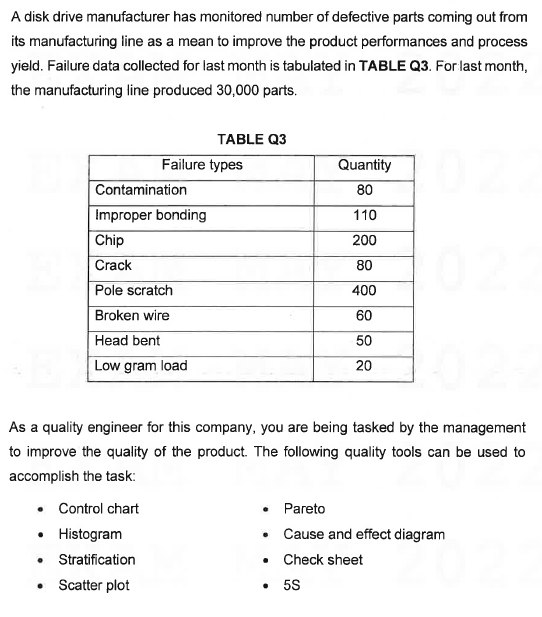
A disk drive manufacturer has monitored number of defective parts coming out from its manufacturing line as a mean to improve the product performances and process yield. Failure data collected for last month is tabulated in TABLE Q3. For last month, the manufacturing line produced 30,000 parts. TABLE 03 As a quality engineer for this company, you are being tasked by the management to improve the quality of the product. The following quality tools can be used to accomplish the task: - Control chart - Histogram - Stratification - Scatter plot - Pareto - Cause and effect diagram - Check sheet - 5S Propose how you can apply all these tools for your task. The tools presented should be in proper sequence and with appropriate illustrations and examples
Step by Step Solution
There are 3 Steps involved in it

Get step-by-step solutions from verified subject matter experts