

Question: pls graph all 3 Moving Average Forecasting - Avocados! Dignment After viewing the video in Module 3. Time Series Forecasting: Introduction, you should be able
pls graph all 3 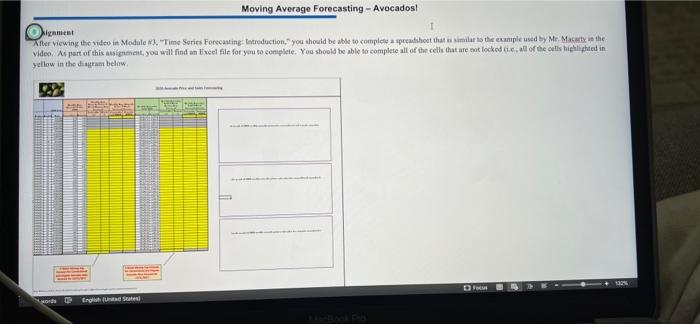
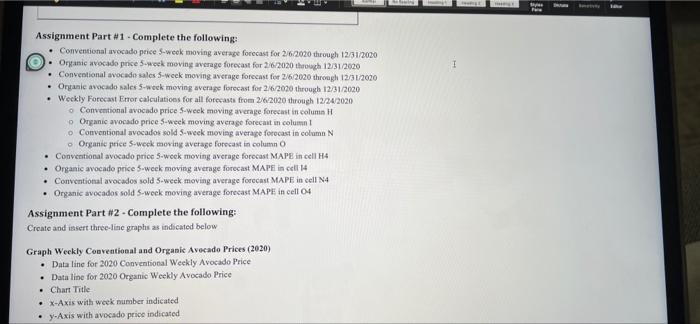
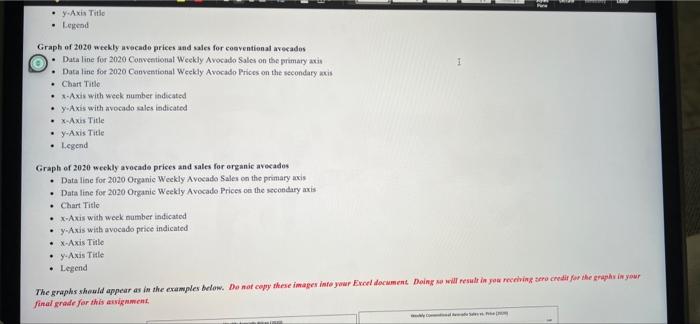
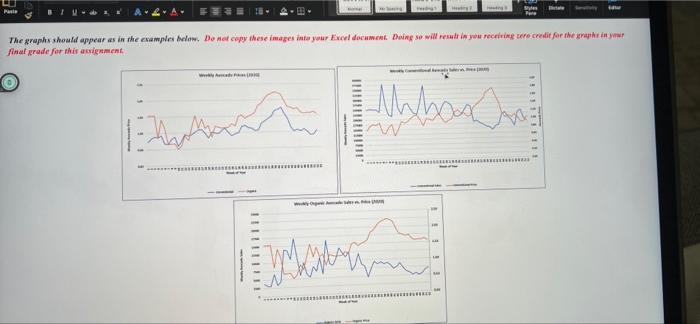
Moving Average Forecasting - Avocados! Dignment After viewing the video in Module 3. "Time Series Forecasting: Introduction, you should be able to complexa predict that is similar to the example used by Mr. Macwty is the video. As part of this assignment, you will find an Excel file for you to complete. You should be able to complete all of the cells that are not locked all of the calls highlighted in yellow in the diagram below D on English (United States Bay - Assignment Part #1. Complete the following: Conventional avocado price 5-week moving average forecast for 2/6/2020 through 12/31/2020 Oranie avocado price 5-week moving werage forecast for 2/6/2020 through 12/31/2020 Conventional avocado sales 5-week moving average forecast for 2/6/2020 through 12/31/2020 Oranie avocado sales 5-week moving average forecast for 2/6/2020 through 12/31/2020 Weekly Forecast Error calculations for all forecasts from 26:2020 through 12/24 2020 Conventional avocado price 5-week moving average forecast incolumn Organic avocado price 5-week moving average forecast in column Conventional avocados sold 5-week moving average forecast in column N Organic price s-week moving average forecast in column Conventional avocado price 5-week moving average forecast MAPE in cell H4 Organic avocado price 3-week moving average forecast MAPE in cell 14 Conventional avocados sold 5-week moving average forecast MAPE in cell N4 Organic avocados sold S-week moving average forecast MAPE in cell 04 Assignment Part #2 - Complete the following Create and insert three-line graphs as indicated below Graph Weekly Conventional and Organic Avocado Prices (2020) . Data line for 2020 Conventional Weekly Avocado Price . Data line for 2020 Organic Weekly Avocado Price Chart Title X-Axis with week number indicated y-Axis with avocado price indicated . y Axis Title . Legend 1 Graph of 2020 weekly avocado prices and sales for conventional avocados . Data line for 2020 Conventional Weekly Avocado Sales on the primary axis . Data line for 2020 Conventional Weekly Avocado Prices on the secondary axis Chart Title . -Axis with week number indicated y-Axis with avocado ales indicated Axis Title y-Axis Title Legend Graph of 2020 weekly avocade prices and sales for organic avecados Data line for 2020 Organic Weekly Avocado Sales on the primary axis . Data line for 2020 Organie Weekly Avocado Prices on the secondary axis Chart Title X-Axis with week number indicated y-Axis with avocado price indicated X-Axis Title Axis Title Legend The graphs should appear as in the examples below. Do not copy these images into your Excel document Doing so will result in you chinese credit for the graph in your final grade for this assignment Paste The graphs should appear as in the examples low. Do not copy these images into your Excel document. Doing we will reale in you receiving toto credit for the graph in your final grade for this assignment. Elham Mabao Tilllilii Moving Average Forecasting - Avocados! Dignment After viewing the video in Module 3. "Time Series Forecasting: Introduction, you should be able to complexa predict that is similar to the example used by Mr. Macwty is the video. As part of this assignment, you will find an Excel file for you to complete. You should be able to complete all of the cells that are not locked all of the calls highlighted in yellow in the diagram below D on English (United States Bay - Assignment Part #1. Complete the following: Conventional avocado price 5-week moving average forecast for 2/6/2020 through 12/31/2020 Oranie avocado price 5-week moving werage forecast for 2/6/2020 through 12/31/2020 Conventional avocado sales 5-week moving average forecast for 2/6/2020 through 12/31/2020 Oranie avocado sales 5-week moving average forecast for 2/6/2020 through 12/31/2020 Weekly Forecast Error calculations for all forecasts from 26:2020 through 12/24 2020 Conventional avocado price 5-week moving average forecast incolumn Organic avocado price 5-week moving average forecast in column Conventional avocados sold 5-week moving average forecast in column N Organic price s-week moving average forecast in column Conventional avocado price 5-week moving average forecast MAPE in cell H4 Organic avocado price 3-week moving average forecast MAPE in cell 14 Conventional avocados sold 5-week moving average forecast MAPE in cell N4 Organic avocados sold S-week moving average forecast MAPE in cell 04 Assignment Part #2 - Complete the following Create and insert three-line graphs as indicated below Graph Weekly Conventional and Organic Avocado Prices (2020) . Data line for 2020 Conventional Weekly Avocado Price . Data line for 2020 Organic Weekly Avocado Price Chart Title X-Axis with week number indicated y-Axis with avocado price indicated . y Axis Title . Legend 1 Graph of 2020 weekly avocado prices and sales for conventional avocados . Data line for 2020 Conventional Weekly Avocado Sales on the primary axis . Data line for 2020 Conventional Weekly Avocado Prices on the secondary axis Chart Title . -Axis with week number indicated y-Axis with avocado ales indicated Axis Title y-Axis Title Legend Graph of 2020 weekly avocade prices and sales for organic avecados Data line for 2020 Organic Weekly Avocado Sales on the primary axis . Data line for 2020 Organie Weekly Avocado Prices on the secondary axis Chart Title X-Axis with week number indicated y-Axis with avocado price indicated X-Axis Title Axis Title Legend The graphs should appear as in the examples below. Do not copy these images into your Excel document Doing so will result in you chinese credit for the graph in your final grade for this assignment Paste The graphs should appear as in the examples low. Do not copy these images into your Excel document. Doing we will reale in you receiving toto credit for the graph in your final grade for this assignment. Elham Mabao Tilllilii Step by Step Solution
There are 3 Steps involved in it
1 Expert Approved Answer
Step: 1 Unlock

Question Has Been Solved by an Expert!
Get step-by-step solutions from verified subject matter experts
Step: 2 Unlock
Step: 3 Unlock