

Question: pls help im running behind on this assignment plot(x,y,k) plot(x,y,b) plot (x,y,b) All of the above What is the correct syntax for plotting the function
pls help im running behind on this assignment 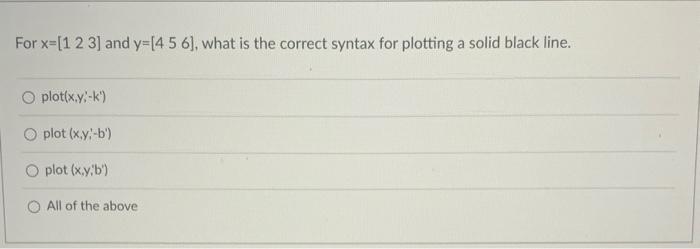
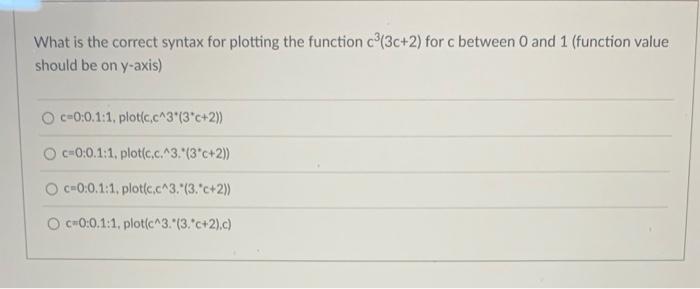
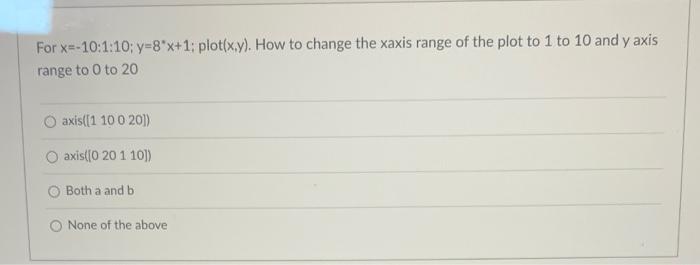
plot(x,y,k) plot(x,y,b) plot (x,y,b) All of the above What is the correct syntax for plotting the function c3(3c+2) for c between 0 and 1 (function value should be on y-axis) c=0:0.1:1, plotic, 3(3c+2)) c=0:0.1:1, plot(c,c, .(3c+2)) c=0:0,1:1, plot(c, c3.(3,c+2)) c"0:0.1:1, plot( (c3.(3.c+2),c) For x=10:1:10;y=8x+1; plot (x,y). How to change the xaxis range of the plot to 1 to 10 and y axis range to 0 to 20 axis([(1 100100]) axis([020110]) Both a and b None of the above
Step by Step Solution
There are 3 Steps involved in it
1 Expert Approved Answer
Step: 1 Unlock

Question Has Been Solved by an Expert!
Get step-by-step solutions from verified subject matter experts
Step: 2 Unlock
Step: 3 Unlock