

Question: pls help with excel The following table shows the hot dogs bought from a street vendor over the course of eight days (Demand). Also shown
pls help with excel 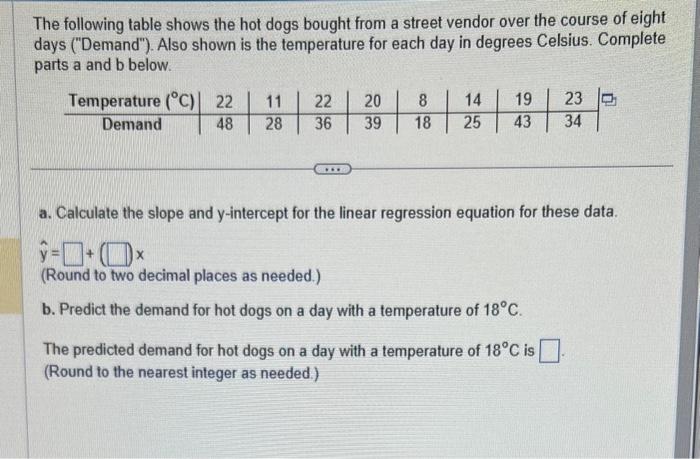
The following table shows the hot dogs bought from a street vendor over the course of eight days ("Demand"). Also shown is the temperature for each day in degrees Celsius. Complete parts a and b below. a. Calculate the slope and y-intercept for the linear regression equation for these data. y^=+1x (Round to two decimal places as needed.) b. Predict the demand for hot dogs on a day with a temperature of 18C. The predicted demand for hot dogs on a day with a temperature of 18C is (Round to the nearest integer as needed.)
Step by Step Solution
There are 3 Steps involved in it
1 Expert Approved Answer
Step: 1 Unlock

Question Has Been Solved by an Expert!
Get step-by-step solutions from verified subject matter experts
Step: 2 Unlock
Step: 3 Unlock