

The following table shows the hot dogs bought from a street vendor over the course of eight
Question:
The following table shows the hot dogs bought from a street vendor over the course of eight days (“Demand”). Also shown is the temperature for each day in degrees Celsius.
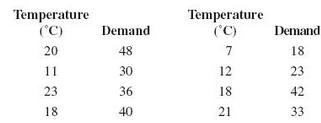
a. Calculate the slope and y intercept for the linear regression equation for these data.
b. Predict the demand for hot dogs on a day with a temperature of 15° C.
c. Verify your results using Excel.
Fantastic news! We've Found the answer you've been seeking!
Step by Step Answer:
a b y 114290 13736 15 320 hot dogs c h bo 270 8 X 20 11 23 ...View the full answer

Answered By
Emel Khan
I have the ability to effectively communicate and demonstrate concepts to students. Through my practical application of the subject required, I am able to provide real-world examples and clarify complex ideas. This helps students to better understand and retain the information, leading to improved performance and confidence in their abilities. Additionally, my hands-on approach allows for interactive lessons and personalized instruction, catering to the individual needs and learning styles of each student.
2+ Reviews
10+ Question Solved
Related Book For 

Question Posted:
