

Question: pls show all steps 2. Inspectors want to develop process control charts to check the weights of cartons of Plaster of Paris. They take ten
pls show all steps 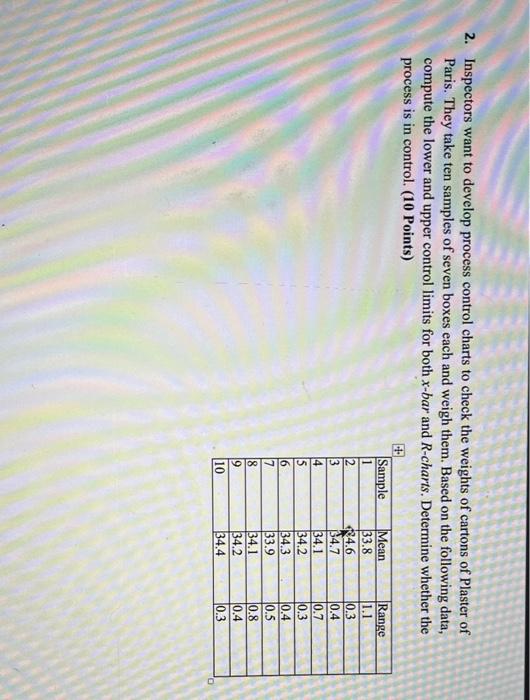
2. Inspectors want to develop process control charts to check the weights of cartons of Plaster of Paris. They take ten samples of seven boxes each and weigh them. Based on the following data, compute the lower and upper control limits for both X-bar and R-charts. Determine whether the process is in control. (10 Points) Sample Mean Range 1 33.8 1.1 2 434.6 0.3 3 34.7 10.4 14 34.1 10.7 5 34.2 0.3 34.3 0.4 7 33.9 0.5 8 34.1 10.8 9 34.2 0.4 10 34.4 0.3 16 Step by Step Solution
There are 3 Steps involved in it
1 Expert Approved Answer
Step: 1 Unlock

Question Has Been Solved by an Expert!
Get step-by-step solutions from verified subject matter experts
Step: 2 Unlock
Step: 3 Unlock