Question: pls show any formulas on excel Cpk Example In the previous semi-conductor example, suppose that the USL and LSL for the chip diameter are 26mm
pls show any formulas on excel
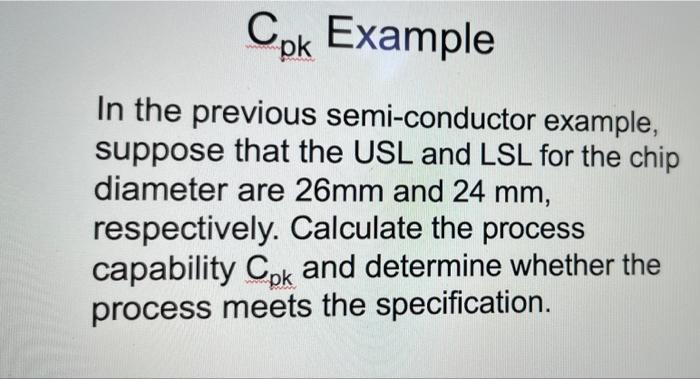
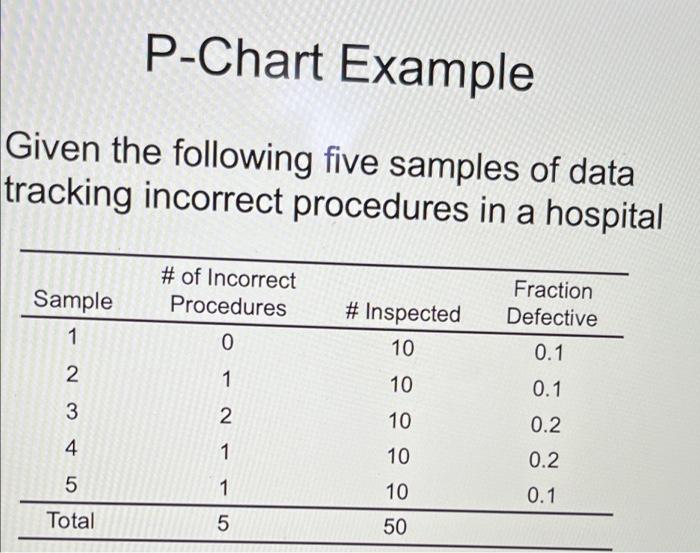
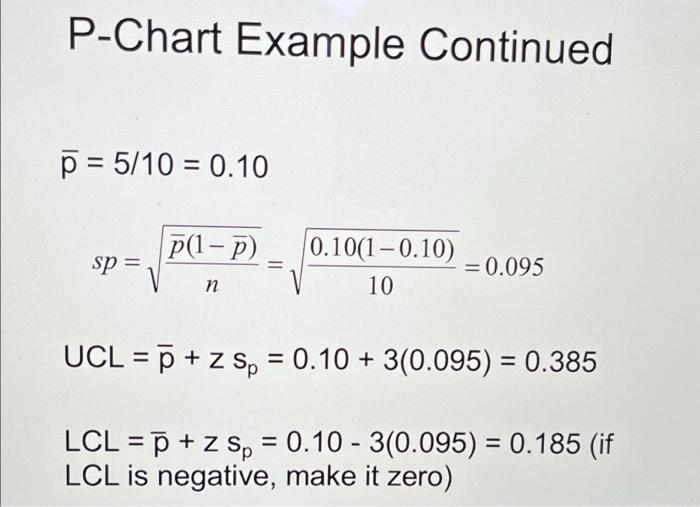
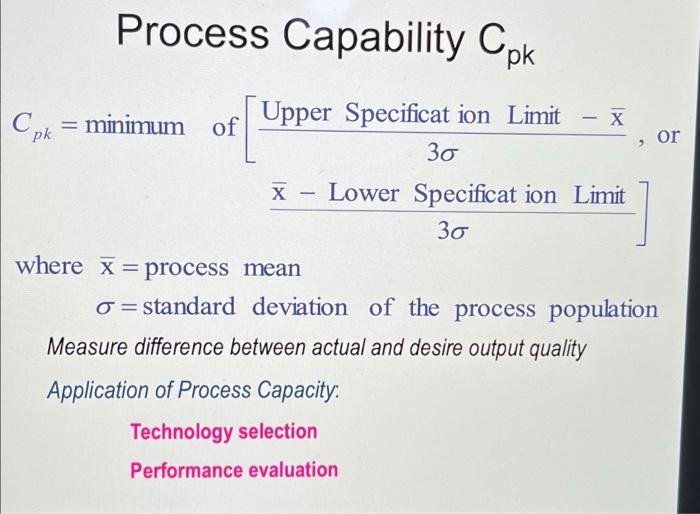
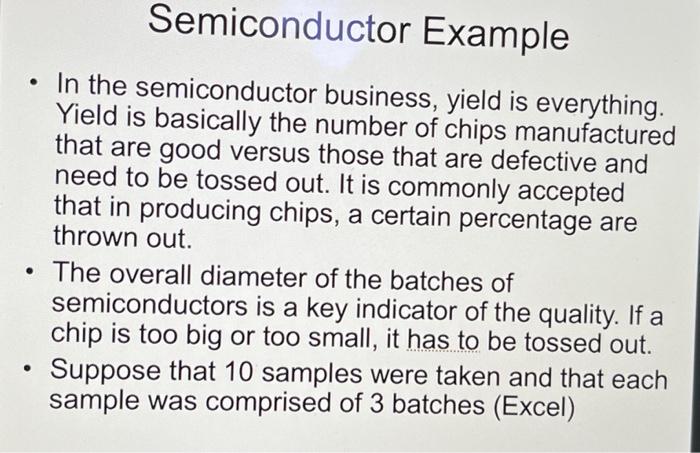
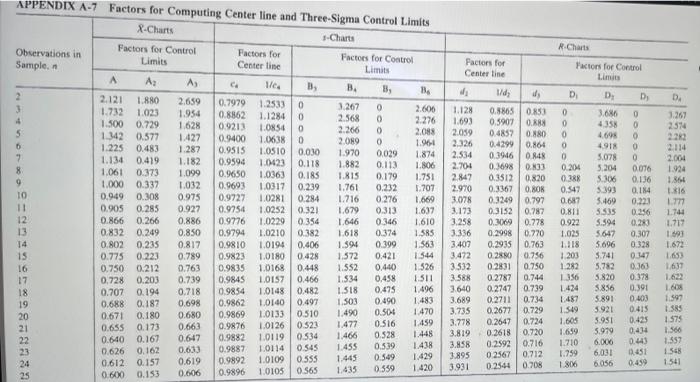
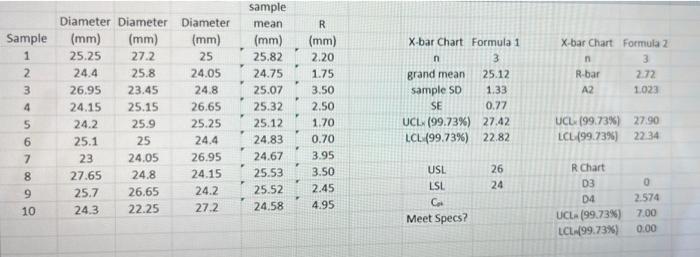
Cpk Example In the previous semi-conductor example, suppose that the USL and LSL for the chip diameter are 26mm and 24 mm, respectively. Calculate the process capability Cpk and determine whether the process meets the specification. P-Chart Example Given the following five samples of data tracking incorrect procedures in a hospital # of Incorrect Procedures Sample 1 Fraction Defective # Inspected 10 0 0.1 2 1 10 0.1 3 2 10 0.2 4 1 10 5 0.2 0.1 1 10 Total 5 50 P-Chart Example Continued p = 5/10 = 0.10 = p(1-P) sp= = 0.10(1 -0.10) = 0.095 10 n UCL = 7 + z Sp = 0.10 + 3(0.095) = 0.385 = = = LCL = p + z Sp = 0.10 - 3(0.095) = 0.185 (if LCL is negative, make it zero) Process Capability Cpk Cok = = minimum of -X or Upper Specificat ion Limit 30 Lower Specificat ion Limit 30 X where x = process mean o=standard deviation of the process population Measure difference between actual and desire output quality Application of Process Capacity: Technology selection Performance evaluation Semiconductor Example In the semiconductor business, yield is everything. Yield is basically the number of chips manufactured that are good versus those that are defective and need to be tossed out. It is commonly accepted that in producing chips, a certain percentage are thrown out. The overall diameter of the batches of semiconductors is a key indicator of the quality. If a chip is too big or too small, it has to be tossed out. Suppose that 10 samples were taken and that each sample was comprised of 3 batches (Excel) R.Charts Am DOO 3.267 2574 APPENDIX A-7 Factors for Computing Center line and Three-Sigma Control Limits X-Charts -Charts Observations in Factors for Control Factors for Sample, Limits Factors for Control Center time Limits A A: Ay leg B B 3, B 2.121 1.880 2.659 0.7979 1.2533 0 1.732 3.267 1.023 0 1.954 2.600 0.8862 1.1284 2.568 0 1.500 0.729 1.628 0.9213 2.276 1.0854 2.266 0 1.342 0.577 2.088 1.427 0.9400 1.038 2.089 0 1.91 1.225 0.483 1.287 0.9515 1.0510 0.030 1.970 0.029 1.134 0.419 1.874 1.182 0.9596 1.0423 8 0.118 1.882 0.113 1,061 1.806 0.373 1.099 0.9650 1.0363 0.185 1.815 0.179 9 1.751 1.000 0.337 1.032 0.9693 1.0317 0.239 1.761 0.232 1.707 0.949 0.308 0.975 0.9727 1.0281 0.284 1.716 0.276 1669 0.905 0.285 0.927 0.9754 1.0252 0.321 1.679 0.313 1.637 0.866 0.266 0.886 0.9776 1.0229 0.354 1.646 0.346 1.610 0.832 0.249 0.850 0.9794 1.0210 0.382 1.618 0.374 1.585 0.802 0.235 0.817 0.9810 1.0194 0.406 1.594 0.399 1.563 0.775 0.223 0.789 0.9823 1.0180 0.428 1.572 0.421 1544 0.750 0.212 0.763 0.9835 1.0168 0.448 1.552 0.440 1.526 17 0.728 0.203 0.739 0.9845 1.0157 0.466 1.534 0,458 1.511 18 0.707 0.194 0.718 09854 1.0148 1.518 0.475 1.496 19 0.688 0.182 0.698 0.9862 10140 0.497 1.503 0.490 1.483 20 0.671 0.180 0.680 0.9869 1.0133 0.510 1.490 0.504 1.470 0.655 0.173 0.663 0.9876 1.0126 0.523 1.477 0.516 1.459 22 0.640 0.167 0.647 0.9882 1.0119 0.534 1.466 0.528 1.448 0.626 0.162 0.633 0.9887 23 0.545 1.0114 0.539 1.455 1.438 24 0.612 0.157 0.619 0.9892 1.0109 1.429 0.555 1.445 0.549 25 0.606 0.6000.153 0.9896 1.420 0.359 1.0105 Pactors for Center Line 1/d, 1.128 0.8865 0.853 1.693 0.5907 0.888 2.059 0.4859 0.880 2.326 0.4299 0.864 2.534 0.39160.848 2.704 0.3698 0.33 2.847 0.3512 0.820 2.970 0.3367 0.80 3.078 0.3249 0.797 3.173 0.3152 0.787 3.258 0.3069 0.778 3.336 0.2998 0.770 3.407 0.2935 0.763 3.472 02880 0.756 3.332 0.2831 0.750 3.588 0.2787 0.744 3.640 0.2747 0.739 3.689 0.2711 0.734 3.735 0.2677 0.729 3.778 0.2647 0.724 3.819 0.2618 0.720 3.858 0.2592 0.716 3.895 0.2567 0.712 3.931 0.2544 0.708 URL85636UR = 5 Factors for Control Limits D D D 0 3.686 0 0 4358 0 0 4.698 0 0 4918 0 0 5.078 0 0.204 5,204 0.076 0.388 5.306 0.136 0.547 5.393 0.184 0.687 5.469 0.223 0.811 5.535 0.256 0.922 5.594 0.283 1.025 5.647 0.307 1.118 5.696 0.328 1.203 5.741 0.347 1.282 5.782 0.363 1356 5.820 0.378 1.424 5856 0.391 1.489 5.891 0.003 1.549 3921 0.415 1.605 5.951 0.425 1.659 0,434 1.710 6.000 0.443 1.759 6,031 0451 1.800 6056 0.459 2114 2.004 1.924 1.864 1:16 177 1.744 1714 1.691 1.673 1653 1.637 0.482 3979 1600 1.597 1585 1.575 1566 1.557 1.548 1541 0565 1.435 R Sample 1 2 3 4 5 6 7 8 9 10 X-bar Chart Formula z n 3 R-bar 2.72 A2 1.023 Diameter Diameter (mm) (mm) 25.25 27.2 24.4 25.8 26.95 23.45 24.15 25.15 24.2 25.9 25.1 25 23 24.05 27.65 24.8 25.7 26.65 24.3 22.25 Diameter (mm) 25 24.05 24.8 26.65 25.25 24.4 26.95 24.15 24.2 27.2 sample mean (mm) 25.82 24.75 25.07 25.32 25.12 24.83 24.67 25.53 25.52 24.58 R (mm) 2.20 1.75 3.50 2.50 1.70 0.70 3.95 3.50 2.45 4.95 X-bar Chart Formula 1 n 3 grand mean 25.12 sample SD 1.33 SE 0.77 UCL (99.73%) 27.42 LCL (99,73%) 22.82 UCL (99 73%) 27.90 LCL 99 73%) 22 34 26 24 USL LSL Com Meet Specs? R Chart D3 0 D4 2.574 UCLA (99.73%) 7.00 LCL499 73%) 0.00 Cpk Example In the previous semi-conductor example, suppose that the USL and LSL for the chip diameter are 26mm and 24 mm, respectively. Calculate the process capability Cpk and determine whether the process meets the specification. P-Chart Example Given the following five samples of data tracking incorrect procedures in a hospital # of Incorrect Procedures Sample 1 Fraction Defective # Inspected 10 0 0.1 2 1 10 0.1 3 2 10 0.2 4 1 10 5 0.2 0.1 1 10 Total 5 50 P-Chart Example Continued p = 5/10 = 0.10 = p(1-P) sp= = 0.10(1 -0.10) = 0.095 10 n UCL = 7 + z Sp = 0.10 + 3(0.095) = 0.385 = = = LCL = p + z Sp = 0.10 - 3(0.095) = 0.185 (if LCL is negative, make it zero) Process Capability Cpk Cok = = minimum of -X or Upper Specificat ion Limit 30 Lower Specificat ion Limit 30 X where x = process mean o=standard deviation of the process population Measure difference between actual and desire output quality Application of Process Capacity: Technology selection Performance evaluation Semiconductor Example In the semiconductor business, yield is everything. Yield is basically the number of chips manufactured that are good versus those that are defective and need to be tossed out. It is commonly accepted that in producing chips, a certain percentage are thrown out. The overall diameter of the batches of semiconductors is a key indicator of the quality. If a chip is too big or too small, it has to be tossed out. Suppose that 10 samples were taken and that each sample was comprised of 3 batches (Excel) R.Charts Am DOO 3.267 2574 APPENDIX A-7 Factors for Computing Center line and Three-Sigma Control Limits X-Charts -Charts Observations in Factors for Control Factors for Sample, Limits Factors for Control Center time Limits A A: Ay leg B B 3, B 2.121 1.880 2.659 0.7979 1.2533 0 1.732 3.267 1.023 0 1.954 2.600 0.8862 1.1284 2.568 0 1.500 0.729 1.628 0.9213 2.276 1.0854 2.266 0 1.342 0.577 2.088 1.427 0.9400 1.038 2.089 0 1.91 1.225 0.483 1.287 0.9515 1.0510 0.030 1.970 0.029 1.134 0.419 1.874 1.182 0.9596 1.0423 8 0.118 1.882 0.113 1,061 1.806 0.373 1.099 0.9650 1.0363 0.185 1.815 0.179 9 1.751 1.000 0.337 1.032 0.9693 1.0317 0.239 1.761 0.232 1.707 0.949 0.308 0.975 0.9727 1.0281 0.284 1.716 0.276 1669 0.905 0.285 0.927 0.9754 1.0252 0.321 1.679 0.313 1.637 0.866 0.266 0.886 0.9776 1.0229 0.354 1.646 0.346 1.610 0.832 0.249 0.850 0.9794 1.0210 0.382 1.618 0.374 1.585 0.802 0.235 0.817 0.9810 1.0194 0.406 1.594 0.399 1.563 0.775 0.223 0.789 0.9823 1.0180 0.428 1.572 0.421 1544 0.750 0.212 0.763 0.9835 1.0168 0.448 1.552 0.440 1.526 17 0.728 0.203 0.739 0.9845 1.0157 0.466 1.534 0,458 1.511 18 0.707 0.194 0.718 09854 1.0148 1.518 0.475 1.496 19 0.688 0.182 0.698 0.9862 10140 0.497 1.503 0.490 1.483 20 0.671 0.180 0.680 0.9869 1.0133 0.510 1.490 0.504 1.470 0.655 0.173 0.663 0.9876 1.0126 0.523 1.477 0.516 1.459 22 0.640 0.167 0.647 0.9882 1.0119 0.534 1.466 0.528 1.448 0.626 0.162 0.633 0.9887 23 0.545 1.0114 0.539 1.455 1.438 24 0.612 0.157 0.619 0.9892 1.0109 1.429 0.555 1.445 0.549 25 0.606 0.6000.153 0.9896 1.420 0.359 1.0105 Pactors for Center Line 1/d, 1.128 0.8865 0.853 1.693 0.5907 0.888 2.059 0.4859 0.880 2.326 0.4299 0.864 2.534 0.39160.848 2.704 0.3698 0.33 2.847 0.3512 0.820 2.970 0.3367 0.80 3.078 0.3249 0.797 3.173 0.3152 0.787 3.258 0.3069 0.778 3.336 0.2998 0.770 3.407 0.2935 0.763 3.472 02880 0.756 3.332 0.2831 0.750 3.588 0.2787 0.744 3.640 0.2747 0.739 3.689 0.2711 0.734 3.735 0.2677 0.729 3.778 0.2647 0.724 3.819 0.2618 0.720 3.858 0.2592 0.716 3.895 0.2567 0.712 3.931 0.2544 0.708 URL85636UR = 5 Factors for Control Limits D D D 0 3.686 0 0 4358 0 0 4.698 0 0 4918 0 0 5.078 0 0.204 5,204 0.076 0.388 5.306 0.136 0.547 5.393 0.184 0.687 5.469 0.223 0.811 5.535 0.256 0.922 5.594 0.283 1.025 5.647 0.307 1.118 5.696 0.328 1.203 5.741 0.347 1.282 5.782 0.363 1356 5.820 0.378 1.424 5856 0.391 1.489 5.891 0.003 1.549 3921 0.415 1.605 5.951 0.425 1.659 0,434 1.710 6.000 0.443 1.759 6,031 0451 1.800 6056 0.459 2114 2.004 1.924 1.864 1:16 177 1.744 1714 1.691 1.673 1653 1.637 0.482 3979 1600 1.597 1585 1.575 1566 1.557 1.548 1541 0565 1.435 R Sample 1 2 3 4 5 6 7 8 9 10 X-bar Chart Formula z n 3 R-bar 2.72 A2 1.023 Diameter Diameter (mm) (mm) 25.25 27.2 24.4 25.8 26.95 23.45 24.15 25.15 24.2 25.9 25.1 25 23 24.05 27.65 24.8 25.7 26.65 24.3 22.25 Diameter (mm) 25 24.05 24.8 26.65 25.25 24.4 26.95 24.15 24.2 27.2 sample mean (mm) 25.82 24.75 25.07 25.32 25.12 24.83 24.67 25.53 25.52 24.58 R (mm) 2.20 1.75 3.50 2.50 1.70 0.70 3.95 3.50 2.45 4.95 X-bar Chart Formula 1 n 3 grand mean 25.12 sample SD 1.33 SE 0.77 UCL (99.73%) 27.42 LCL (99,73%) 22.82 UCL (99 73%) 27.90 LCL 99 73%) 22 34 26 24 USL LSL Com Meet Specs? R Chart D3 0 D4 2.574 UCLA (99.73%) 7.00 LCL499 73%) 0.00