

Question: pls use codes that run in Jupyter notebook Bar Bar Charts and Pie Charts His Plo Q06.30 According to the University of Waterloo, world energy
pls use codes that run in Jupyter notebook
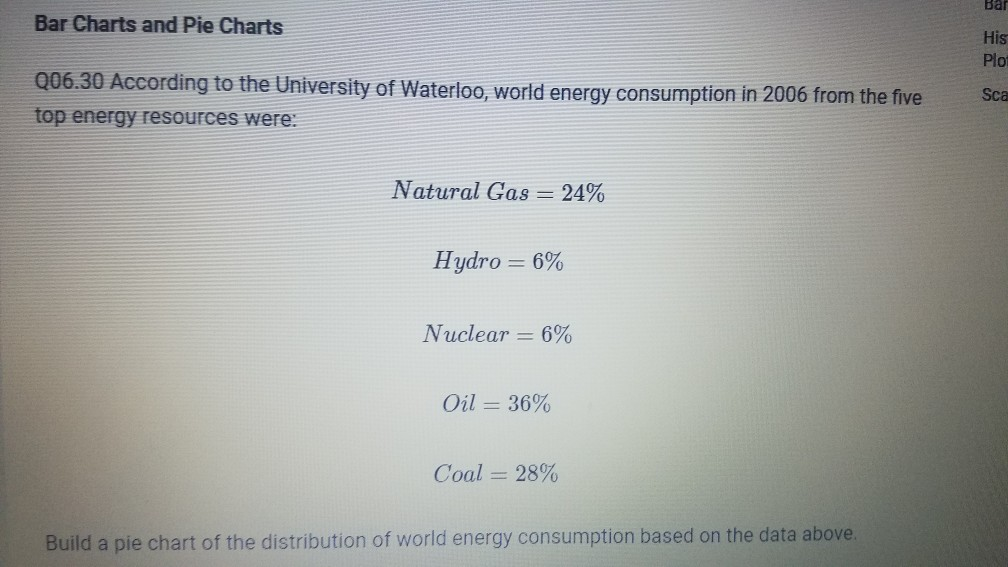
Bar Bar Charts and Pie Charts His Plo Q06.30 According to the University of Waterloo, world energy consumption in 2006 from the five top energy resources were: Sca Natural Gas = 24% Hydro = 6% Nuclear = 6% Oil = 36% Coal = 28% Build a pie chart of the distribution of world energy consumption based on the data above
Step by Step Solution
There are 3 Steps involved in it
1 Expert Approved Answer
Step: 1 Unlock

Question Has Been Solved by an Expert!
Get step-by-step solutions from verified subject matter experts
Step: 2 Unlock
Step: 3 Unlock