

Question: plz answer this question in R , I need the source code. 3. (40 points) In their 1994 book, The Bell Curve: Intelligence and Class
plz answer this question in R , I need the source code.
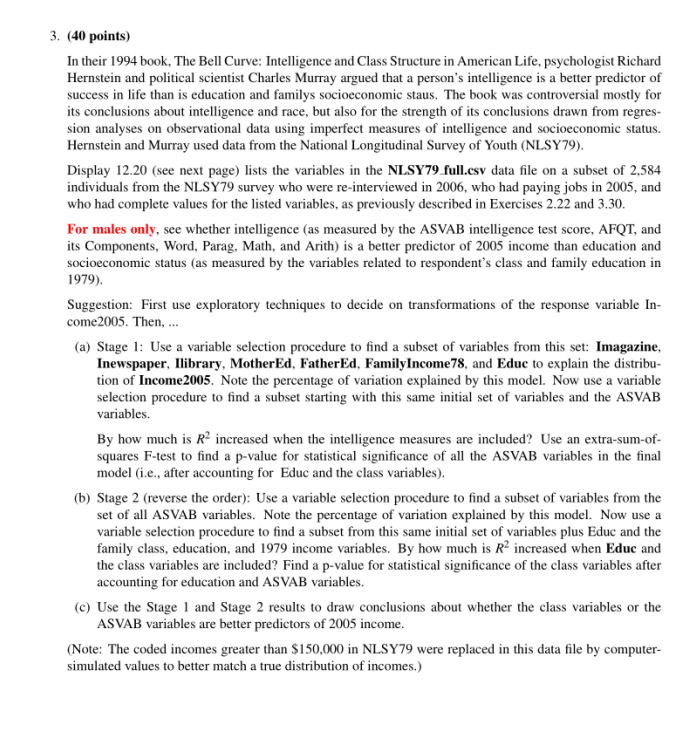
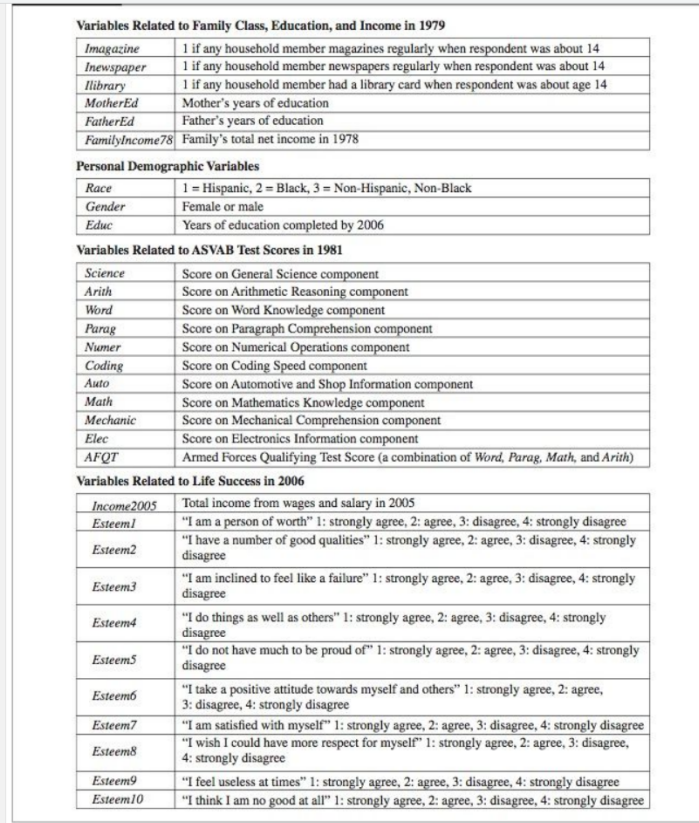
3. (40 points) In their 1994 book, The Bell Curve: Intelligence and Class Structure in American Life, psychologist Richard Hernstein and political scientist Charles Murray argued that a person's intelligence is a better predictor of success in life than is education and familys socioeconomic staus. The book was controversial mostly for its conclusions about intelligence and race, but also for the strength of its conclusions drawn from regres- sion analyses on observational data using imperfect measures of intelligence and socioeconomic status. Hernstein and Murray used data from the National Longitudinal Survey of Youth (NLSY79). Display 12.20 (see next page) lists the variables in the NLSY79 full.esy data file on a subset of 2,584 individuals from the NLSY79 survey who were re-interviewed in 2006, who had paying jobs in 2005, and who had complete values for the listed variables, as previously described in Exercises 2.22 and 3.30. For males only, see whether intelligence (as measured by the ASVAB intelligence test score, AFQT, and its Components, Word, Parag, Math, and Arith) is a better predictor of 2005 income than education and socioeconomic status (as measured by the variables related to respondent's class and family education in 1979). Suggestion: First use exploratory techniques to decide on transformations of the response variable In- come 2005. Then, ... (a) Stage 1: Use a variable selection procedure to find a subset of variables from this set: Imagazine, Inewspaper, Ilibrary, MotherEd, FatherEd, FamilyIncome78, and Educ to explain the distribu- tion of Income2005. Note the percentage of variation explained by this model. Now use a variable selection procedure to find a subset starting with this same initial set of variables and the ASVAB variables. By how much is R increased when the intelligence measures are included? Use an extra-sum-of- squares F-test to find a p-value for statistical significance of all the ASVAB variables in the final model (i.e., after accounting for Educ and the class variables). (b) Stage 2 (reverse the order): Use a variable selection procedure to find a subset of variables from the set of all ASVAB variables. Note the percentage of variation explained by this model. Now use a variable selection procedure to find a subset from this same initial set of variables plus Educ and the family class, education, and 1979 income variables. By how much is R increased when Educ and the class variables are included? Find a p-value for statistical significance of the class variables after accounting for education and ASVAB variables. (c) Use the Stage 1 and Stage 2 results to draw conclusions about whether the class variables or the ASVAB variables are better predictors of 2005 income. (Note: The coded incomes greater than $150,000 in NLSY79 were replaced in this data file by computer- simulated values to better match a true distribution of incomes.) 3. (40 points) In their 1994 book, The Bell Curve: Intelligence and Class Structure in American Life, psychologist Richard Hernstein and political scientist Charles Murray argued that a person's intelligence is a better predictor of success in life than is education and familys socioeconomic staus. The book was controversial mostly for its conclusions about intelligence and race, but also for the strength of its conclusions drawn from regres- sion analyses on observational data using imperfect measures of intelligence and socioeconomic status. Hernstein and Murray used data from the National Longitudinal Survey of Youth (NLSY79). Display 12.20 (see next page) lists the variables in the NLSY79 full.esy data file on a subset of 2,584 individuals from the NLSY79 survey who were re-interviewed in 2006, who had paying jobs in 2005, and who had complete values for the listed variables, as previously described in Exercises 2.22 and 3.30. For males only, see whether intelligence (as measured by the ASVAB intelligence test score, AFQT, and its Components, Word, Parag, Math, and Arith) is a better predictor of 2005 income than education and socioeconomic status (as measured by the variables related to respondent's class and family education in 1979). Suggestion: First use exploratory techniques to decide on transformations of the response variable In- come 2005. Then, ... (a) Stage 1: Use a variable selection procedure to find a subset of variables from this set: Imagazine, Inewspaper, Ilibrary, MotherEd, FatherEd, FamilyIncome78, and Educ to explain the distribu- tion of Income2005. Note the percentage of variation explained by this model. Now use a variable selection procedure to find a subset starting with this same initial set of variables and the ASVAB variables. By how much is R increased when the intelligence measures are included? Use an extra-sum-of- squares F-test to find a p-value for statistical significance of all the ASVAB variables in the final model (i.e., after accounting for Educ and the class variables). (b) Stage 2 (reverse the order): Use a variable selection procedure to find a subset of variables from the set of all ASVAB variables. Note the percentage of variation explained by this model. Now use a variable selection procedure to find a subset from this same initial set of variables plus Educ and the family class, education, and 1979 income variables. By how much is R increased when Educ and the class variables are included? Find a p-value for statistical significance of the class variables after accounting for education and ASVAB variables. (c) Use the Stage 1 and Stage 2 results to draw conclusions about whether the class variables or the ASVAB variables are better predictors of 2005 income. (Note: The coded incomes greater than $150,000 in NLSY79 were replaced in this data file by computer- simulated values to better match a true distribution of incomes.)
Step by Step Solution
There are 3 Steps involved in it

Get step-by-step solutions from verified subject matter experts