

Question: plz do c and d in STATA MODE , thank you On the text website, http://www.pearsonhighered.com/stock_watson/, you will find the data file Growth, which contains
 plz do c and d in STATA MODE, thank you
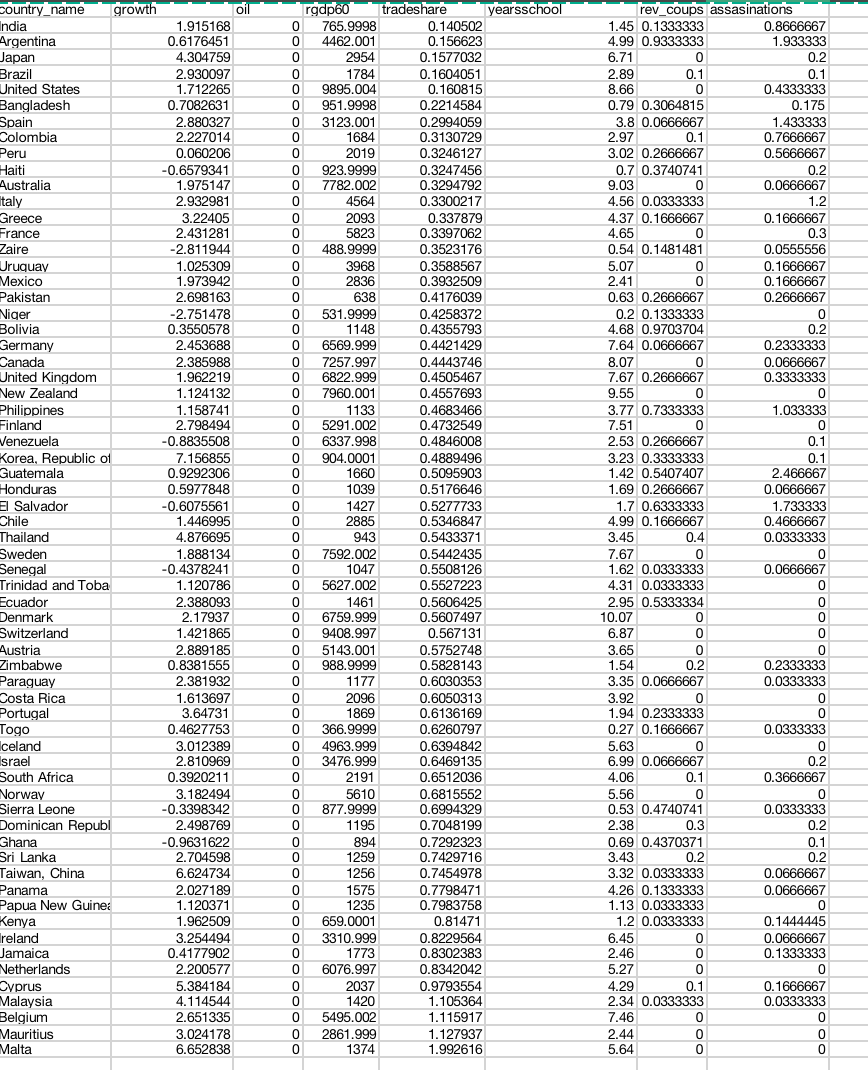
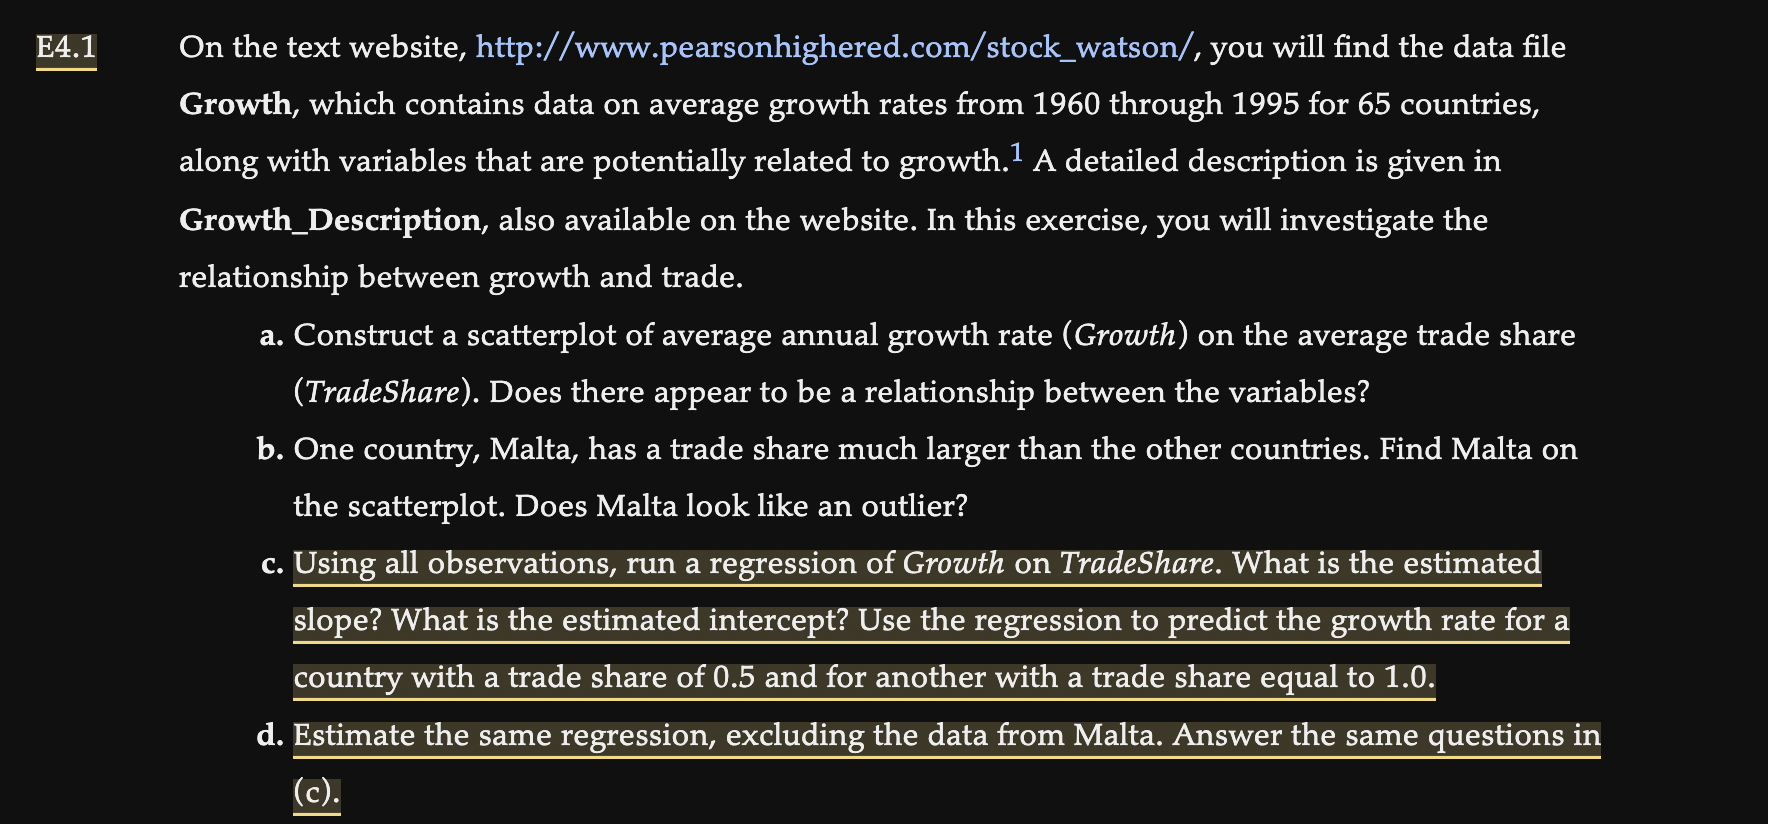
On the text website, http://www.pearsonhighered.com/stock_watson/, you will find the data file Growth, which contains data on average growth rates from 1960 through 1995 for 65 countries, along with variables that are potentially related to growth. 1 A detailed description is given in Growth_Description, also available on the website. In this exercise, you will investigate the relationship between growth and trade. a. Construct a scatterplot of average annual growth rate (Growth) on the average trade share (TradeShare). Does there appear to be a relationship between the variables? b. One country, Malta, has a trade share much larger than the other countries. Find Malta on the scatterplot. Does Malta look like an outlier? c. Using all observations, run a regression of Growth on TradeShare. What is the estimated slope? What is the estimated intercept? Use the regression to predict the growth rate for a country with a trade share of 0.5 and for another with a trade share equal to 1.0. d. Estimate the same regression, excluding the data from Malta. Answer the same questions in On the text website, http://www.pearsonhighered.com/stock_watson/, you will find the data file Growth, which contains data on average growth rates from 1960 through 1995 for 65 countries, along with variables that are potentially related to growth. 1 A detailed description is given in Growth_Description, also available on the website. In this exercise, you will investigate the relationship between growth and trade. a. Construct a scatterplot of average annual growth rate (Growth) on the average trade share (TradeShare). Does there appear to be a relationship between the variables? b. One country, Malta, has a trade share much larger than the other countries. Find Malta on the scatterplot. Does Malta look like an outlier? c. Using all observations, run a regression of Growth on TradeShare. What is the estimated slope? What is the estimated intercept? Use the regression to predict the growth rate for a country with a trade share of 0.5 and for another with a trade share equal to 1.0. d. Estimate the same regression, excluding the data from Malta. Answer the same questions in
Step by Step Solution
There are 3 Steps involved in it

Get step-by-step solutions from verified subject matter experts