

Question: plz do the plot graph part the result should be a three straight lines with negative slope 2 Comparisons of numerical integration methods (80 points)
 plz do the plot graph part the result should be a three straight lines with negative slope
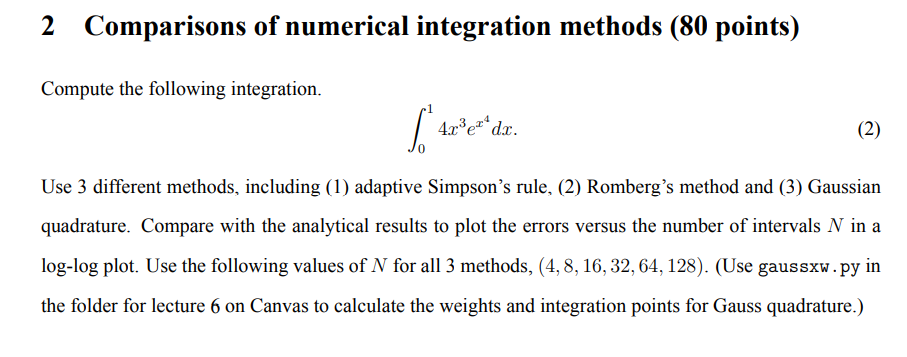
2 Comparisons of numerical integration methods (80 points) Compute the following integration. 014x3ex4dx Use 3 different methods, including (1) adaptive Simpson's rule, (2) Romberg's method and (3) Gaussian quadrature. Compare with the analytical results to plot the errors versus the number of intervals N in a log-log plot. Use the following values of N for all 3 methods, (4,8,16,32,64,128). (Use gaussxw . py in the folder for lecture 6 on Canvas to calculate the weights and integration points for Gauss quadrature.)
Step by Step Solution
There are 3 Steps involved in it
1 Expert Approved Answer
Step: 1 Unlock

Question Has Been Solved by an Expert!
Get step-by-step solutions from verified subject matter experts
Step: 2 Unlock
Step: 3 Unlock