

Question: Frequency-domain sampling consider the following discrete-time signal, where a = 0.95 and L = 10.(a) Compute and plot the signal x(n).(b) Show that, Plot X(?)
Frequency-domain sampling consider the following discrete-time signal, where a = 0.95 and L = 10.(a) Compute and plot the signal x(n).(b) Show that, Plot X(?) by computing it at ? = ?k/100, k = 0, 1, . . . , 100.(c) Compute, for N = 30.(d) Determine and plot the signal. What is the relation between the signals x(n) and (n)? Explain.(e) Compute and plot the signal 1(n) = ??=-?x(n- lN), -L ? n ? L for N = 30. Compare the signals (n) and 1(n)(f) Repeat parts (c) to (e) for N = 15.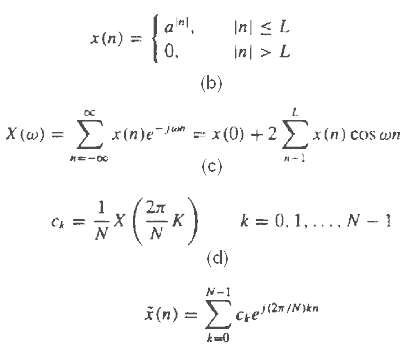
aml, In| < L x(n) = 0, in > L (b) X (@) = x(n)e jun = x (0) +2 > x(n) cos wn n-1 *=-00 (c) k = 0, 1, ..., N - 1 -K = 12 (d) N-1 (n) = Cre2n/IN en
Step by Step Solution
3.52 Rating (166 Votes )
There are 3 Steps involved in it
a Refer to figure b ... View full answer

Get step-by-step solutions from verified subject matter experts
Document Format (1 attachment)
31-E-T-E-D-S-P (768).docx
120 KBs Word File