

Question: plz help by solving both questions Plot the radial distribution function that you chose from the last question. You may use Excel spreadsheet to plot
 plz help by solving both questions
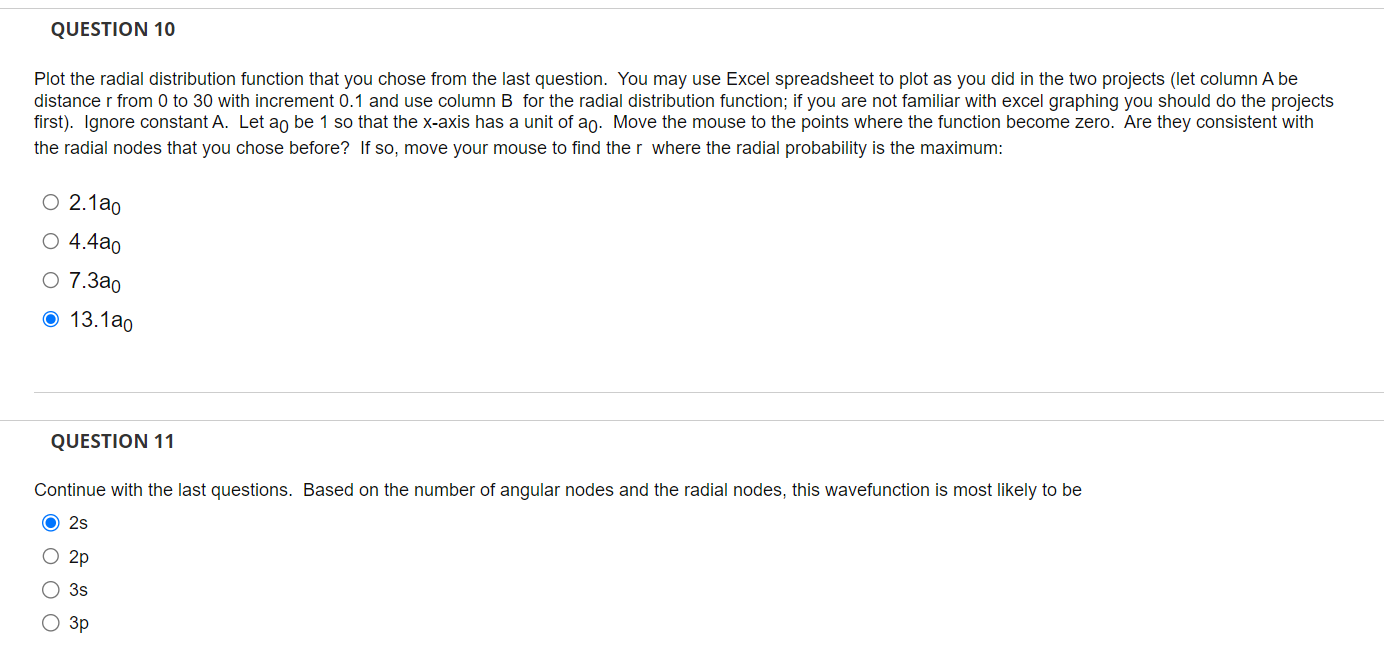
Plot the radial distribution function that you chose from the last question. You may use Excel spreadsheet to plot as you did in the two projects (let column A be distance r from 0 to 30 with increment 0.1 and use column B for the radial distribution function; if you are not familiar with excel graphing you should do the projects first). Ignore constant A. Let a0 be 1 so that the x-axis has a unit of a0. Move the mouse to the points where the function become zero. Are they consistent with the radial nodes that you chose before? If so, move your mouse to find the r where the radial probability is the maximum: 2.1a0 4.4a0 7.3a0 13.1a0 QUESTION 11 Continue with the last questions. Based on the number of angular nodes and the radial nodes, this wavefunction is most likely to be 2s 2p 3s 3p Plot the radial distribution function that you chose from the last question. You may use Excel spreadsheet to plot as you did in the two projects (let column A be distance r from 0 to 30 with increment 0.1 and use column B for the radial distribution function; if you are not familiar with excel graphing you should do the projects first). Ignore constant A. Let a0 be 1 so that the x-axis has a unit of a0. Move the mouse to the points where the function become zero. Are they consistent with the radial nodes that you chose before? If so, move your mouse to find the r where the radial probability is the maximum: 2.1a0 4.4a0 7.3a0 13.1a0 QUESTION 11 Continue with the last questions. Based on the number of angular nodes and the radial nodes, this wavefunction is most likely to be 2s 2p 3s 3p
Step by Step Solution
There are 3 Steps involved in it

Get step-by-step solutions from verified subject matter experts