

Question: Plz read this question and answer accordingly the question and calculate using all datas draw the graph of Fugacity co efficient vs Reduced pressure. for
Plz read this question and answer accordingly the question and calculate using all datas draw the graph of Fugacity co efficient vs Reduced pressure.
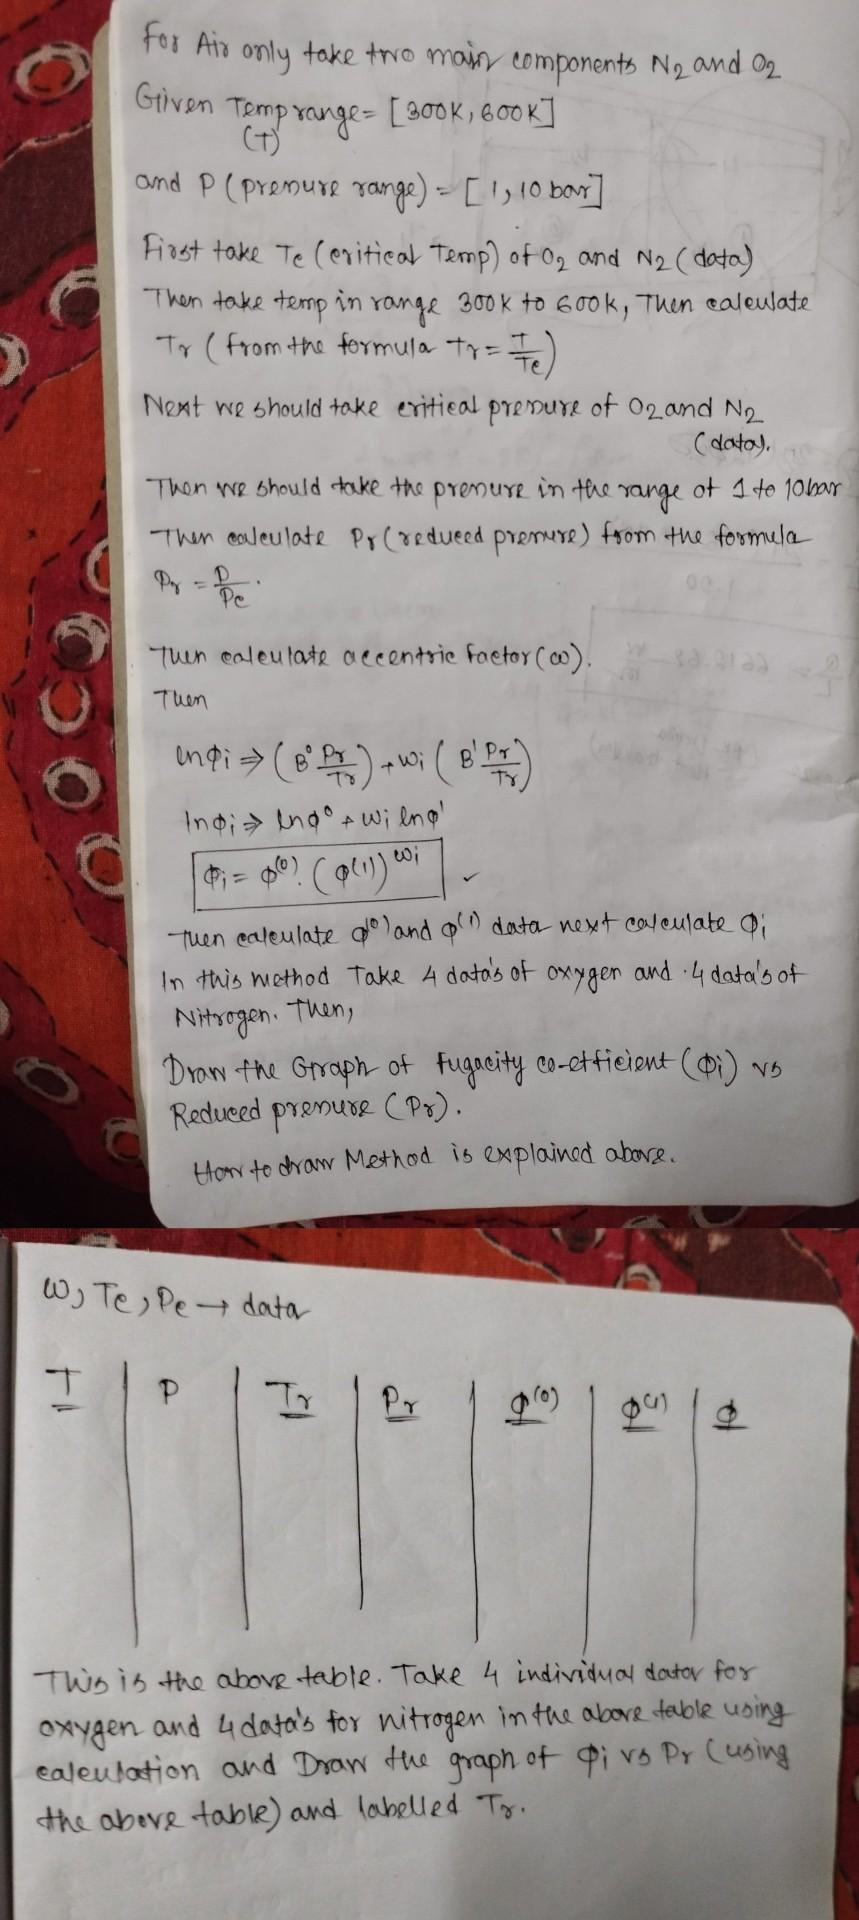
for Ais only take two main componento Ng and 02 Given Temprange- [800K, 600K] and P(premux range) - [1, 10 bov] First take Te (eritical Temp) of O2 and N2 (data) Then take temp in range 300K to 600k, Then cakewlate To (from the formula to = 17 ) Next we should take eritical presure of Ozand N2 (data). Then we should take the prenure in the range of 1 to 10 bar Then couleulate Pr (redueed prenure) from the formula By Pe Then coleutate accentrie foetor (w). Then endi 8 Ar awi ( 8' P) Indiendo Wilna 0,= 80% Coll) Then calculate poland plo) data next calculate o; In this method Take 4 data's of oxygen and 4 data's of Pr A Nitrogen. Then, Draw the Graph of fugacity co-efficient (Oi) va Reduced pramuse CPx). ( How to draw Method is explained above. W. Te, pe data T P. Tr Pr aro) This is the above table. Take 4 individual dator for oxygen and 4 data's for nitrogen in the above table using caleulation and Draw the graph of Pivo Py (using the above table) and labelled To
Step by Step Solution
There are 3 Steps involved in it

Get step-by-step solutions from verified subject matter experts