

Question: plz use R to solve this question. Thanks Problem # 1. A control chart is used to control the fraction nonconforming for a plastic part
plz use R to solve this question. Thanks
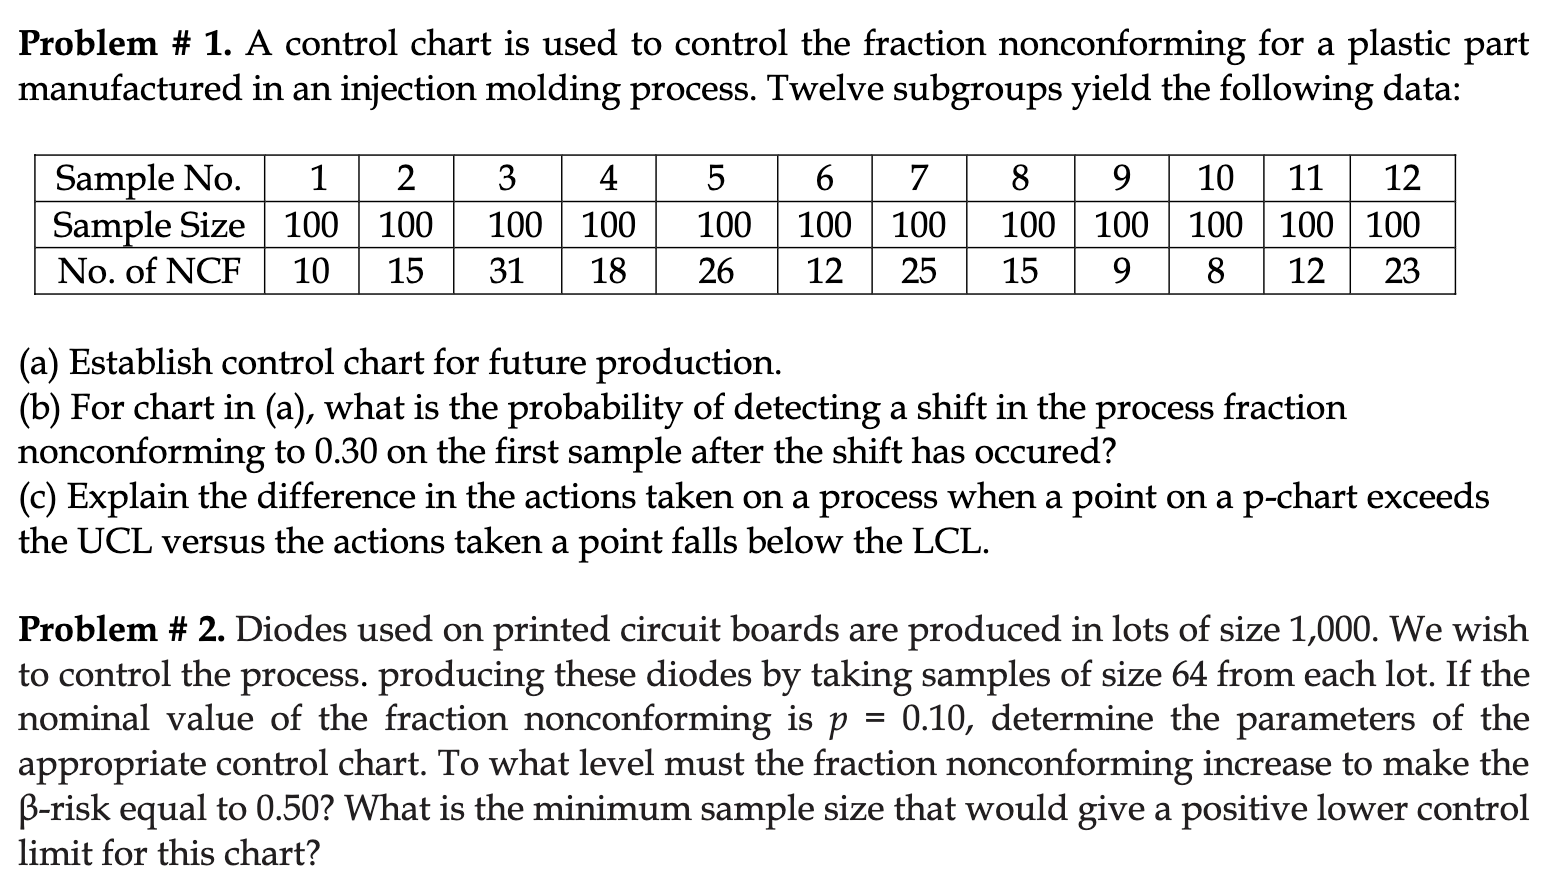
Problem # 1. A control chart is used to control the fraction nonconforming for a plastic part manufactured in an injection molding process. Twelve subgroups yield the following data: Sample No. 1 2 3 4 5 6 7 8 9 10 11 12 Samle Size 100 100 100 100 100 100 100 100 100 100 100 100 --------\"u (a) Establish control chart for future production. (b) For chart in (a), what is the probability of detecting a shift in the process fraction nonconforming to 0.30 on the rst sample after the shift has occured? (c) Explain the difference in the actions taken on a process when a point on a p-chart exceeds the UCL versus the actions taken a point falls below the LCL. Problem # 2. Diodes used on printed circuit boards are produced in lots of size 1,000. We wish to control the process. producing these diodes by taking samples of size 64 from each lot. If the nominal value of the fraction nonconforming is p = 0.10, determine the parameters of the appropriate control chart. To what level must the fraction nonconforming increase to make the -risk equal to 0.50? What is the minimum sample size that would give a positive lower control limit for this chart
Step by Step Solution
There are 3 Steps involved in it

Get step-by-step solutions from verified subject matter experts