

Question: plzzz With steps explaining how to use the minitab I have to follow the steps on my computer and I Don't know how to use
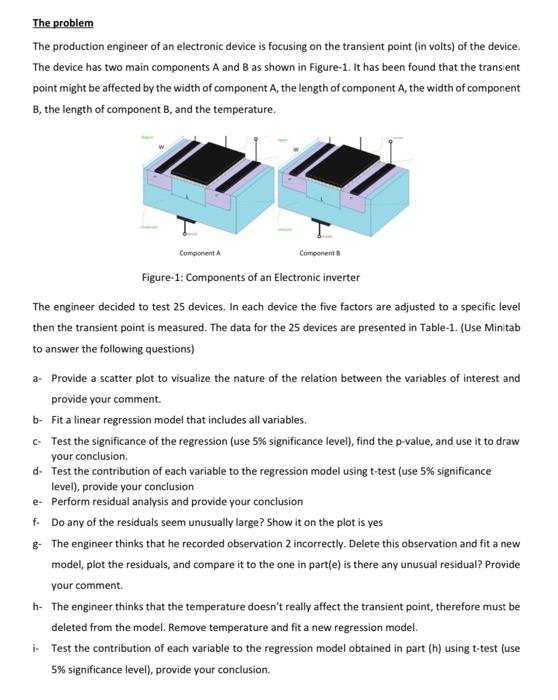
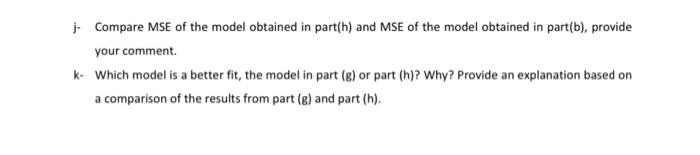
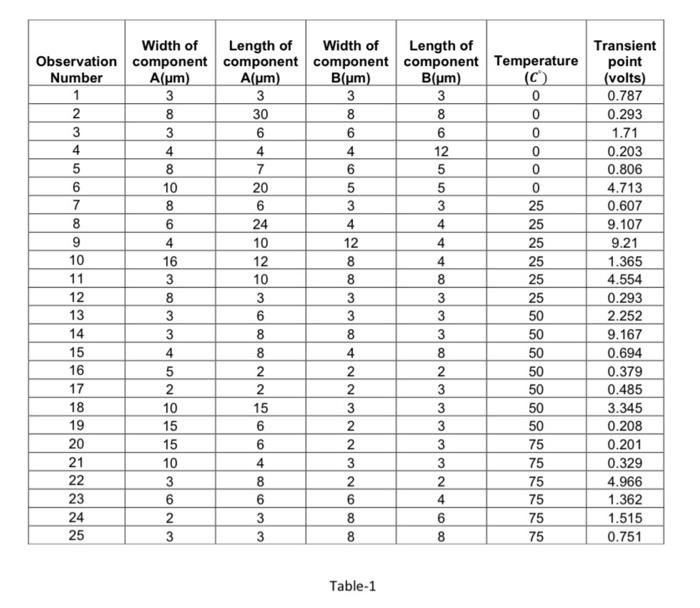
In this project you need to apply what you learned in class to solve a real-life problem. You also need to use a statistical software (Minitab) to facilitate the calculations and support your conclusions. You need to submit a report including the solution and analysis of the required tasks. The report must be formatted as a technical report as if you will be submitting it to the manager. Your report should include the following: Cover page (Including project title, you name and date). Introduction (Explain the purpose of this report and briefly describe the content of the report). Project tasks results, analysis, and discussion Tables and/or graphs are to be used to presents your results. All figures and tables must be labeled and numbered. Conclusion (including main findings and recommendations for management). References (indicate any source you used such as books, articles, web pages...etc.). The problem The production engineer of an electronic device is focusing on the transient point (in volts) of the device. The device has two main components A and B as shown in Figure-1. It has been found that the transient point might be affected by the width of component A, the length of component A, the width of component B, the length of component B, and the temperature. I Component Component Figure-1: Components of an Electronic inverter The engineer decided to test 25 devices. In each device the five factors are adjusted to a specific level then the transient point is measured. The data for the 25 devices are presented in Table-1. (Use Minitab to answer the following questions) 2. Provide a scatter plot to visualize the nature of the relation between the variables of interest and provide your comment b- Fit a linear regression model that includes all variables. Test the significance of the regression (use 5% significance level), find the p-value, and use it to draw your conclusion d- Test the contribution of each variable to the regression model using t-test (use 5% significance level), provide your conclusion e Perform residual analysis and provide your conclusion f. Do any of the residuals seem unusually large? Show it on the plot is yes & The engineer thinks that he recorded observation 2 incorrectly. Delete this observation and fit a new model, plot the residuals, and compare it to the one in part(e) is there any unusual residual? Provide your comment. h- The engineer thinks that the temperature doesn't really affect the transient point, therefore must be deleted from the model. Remove temperature and fit a new regression model. - Test the contribution of each variable to the regression model obtained in part (h) using t-test (use 5% significance level), provide your conclusion. - Compare MSE of the model obtained in part(h) and MSE of the model obtained in part(b), provide your comment. k Which model is a better fit, the model in part (e) or part (h)? Why? Provide an explanation based on a comparison of the results from part (e) and part (h). Width of Length of Width of Length of Observation component component component component Temperature Number A(um) Alum) Blum) B(um) 1 3 3 3 3 0 2 8 30 8 8 0 3 3 6 6 6 0 4 4 4 4 12 0 5 8 7 6 5 0 6 10 20 5 5 0 7 8 6 3 3 25 8 6 24 4 4 25 9 4 10 12 4 25 10 16 12 8 25 11 3 10 8 25 12 3 3 3 25 13 3 6 3 3 50 14 3 8 8 3 50 15 4 8 4 8 50 16 5 2 2 2 50 17 2 2 2 3 50 18 10 15 3 50 19 15 6 2 3 50 20 15 6 2 3 75 21 10 4 3 75 22 3 8 2 2 75 23 6 6 6 4 75 24 2 3 6 75 25 3 3 8 8 75 Transient point (volts) 0.787 0.293 1.71 0.203 0.806 4.713 0.607 9.107 9.21 1.365 4.554 0.293 2.252 9.167 0.694 0.379 0.485 3.345 0.208 0.201 0.329 4.966 1.362 1.515 0.751 /00 10000 NO WWW.00 A 00 00 ONWNNWNN 00 ON Table-1
Step by Step Solution
There are 3 Steps involved in it

Get step-by-step solutions from verified subject matter experts