

Question: PMS2413 Computer Application for Business Lab Test (30 Marks) INSTRUCTIONS: Complete the task based on the instruction given. Data Entry Create a sales projection worksheet
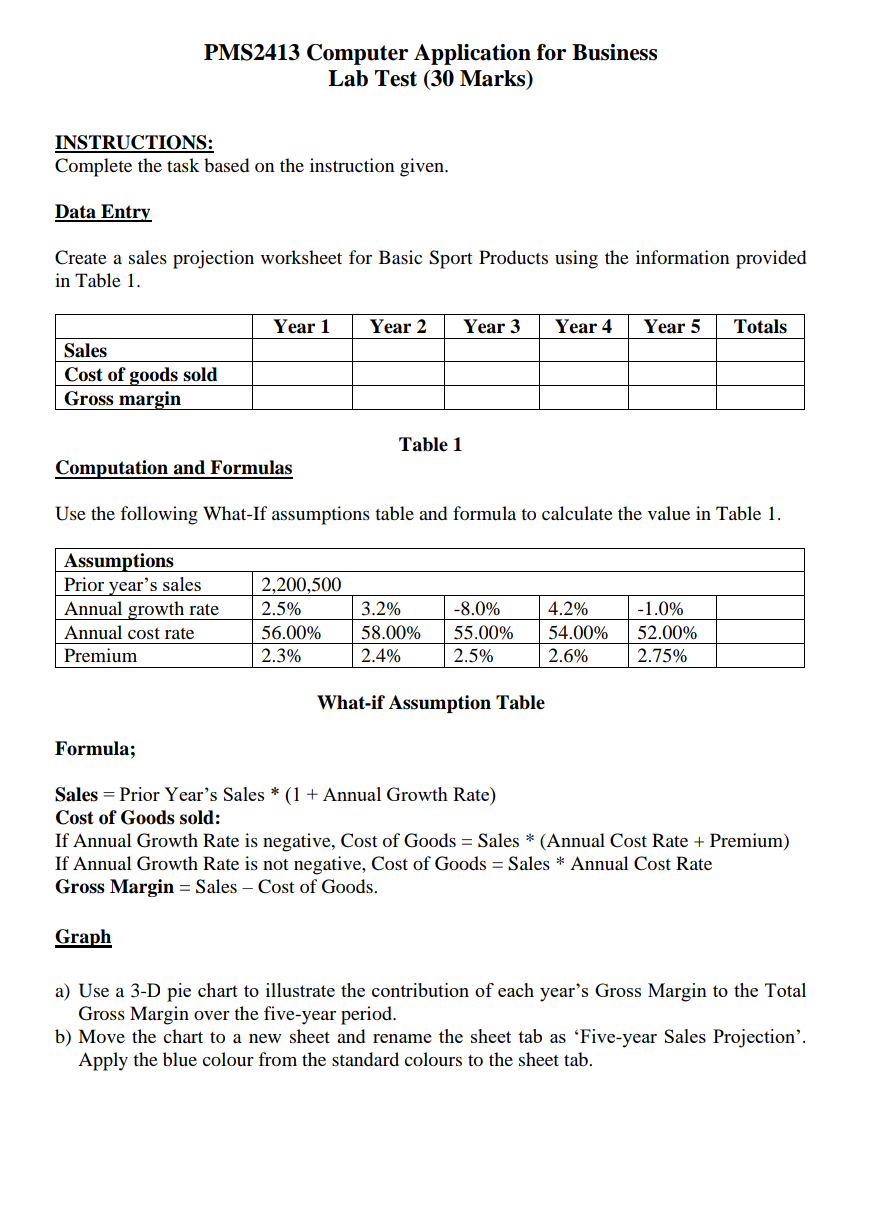
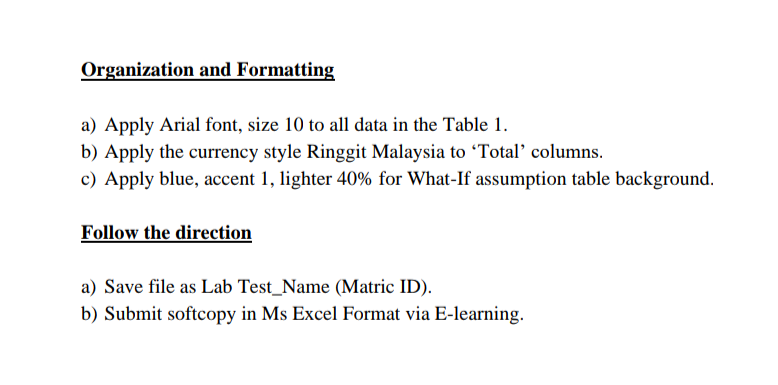
PMS2413 Computer Application for Business Lab Test (30 Marks) INSTRUCTIONS: Complete the task based on the instruction given. Data Entry Create a sales projection worksheet for Basic Sport Products using the information provided in Table 1. Year 1 Year 2 Year 3 Year 4 Year 5 Totals Sales Cost of goods sold Gross margin Table 1 Computation and Formulas Use the following What-If assumptions table and formula to calculate the value in Table 1. Assumptions Prior year's sales Annual growth rate Annual cost rate Premium 2,200,500 2.5% 56.00% 2.3% 3.2% 58.00% 2.4% -8.0% 55.00% 2.5% 4.2% 54.00% 2.6% -1.0% 52.00% 2.75% What-if Assumption Table Formula; Sales = Prior Year's Sales * (1 + Annual Growth Rate) Cost of Goods sold: If Annual Growth Rate is negative, Cost of Goods = Sales * (Annual Cost Rate + Premium) If Annual Growth Rate is not negative, Cost of Goods = Sales * Annual Cost Rate Gross Margin = Sales - Cost of Goods. Graph a) Use a 3-D pie chart to illustrate the contribution of each year's Gross Margin to the Total Gross Margin over the five-year period. b) Move the chart to a new sheet and rename the sheet tab as 'Five-year Sales Projection'. Apply the blue colour from the standard colours to the sheet tab. Organization and Formatting a) Apply Arial font, size 10 to all data in the Table 1. b) Apply the currency style Ringgit Malaysia to Total columns. c) Apply blue, accent 1, lighter 40% for What-If assumption table background. Follow the direction a) Save file as Lab Test_Name (Matric ID). b) Submit softcopy in Ms Excel Format via E-learning. PMS2413 Computer Application for Business Lab Test (30 Marks) INSTRUCTIONS: Complete the task based on the instruction given. Data Entry Create a sales projection worksheet for Basic Sport Products using the information provided in Table 1. Year 1 Year 2 Year 3 Year 4 Year 5 Totals Sales Cost of goods sold Gross margin Table 1 Computation and Formulas Use the following What-If assumptions table and formula to calculate the value in Table 1. Assumptions Prior year's sales Annual growth rate Annual cost rate Premium 2,200,500 2.5% 56.00% 2.3% 3.2% 58.00% 2.4% -8.0% 55.00% 2.5% 4.2% 54.00% 2.6% -1.0% 52.00% 2.75% What-if Assumption Table Formula; Sales = Prior Year's Sales * (1 + Annual Growth Rate) Cost of Goods sold: If Annual Growth Rate is negative, Cost of Goods = Sales * (Annual Cost Rate + Premium) If Annual Growth Rate is not negative, Cost of Goods = Sales * Annual Cost Rate Gross Margin = Sales - Cost of Goods. Graph a) Use a 3-D pie chart to illustrate the contribution of each year's Gross Margin to the Total Gross Margin over the five-year period. b) Move the chart to a new sheet and rename the sheet tab as 'Five-year Sales Projection'. Apply the blue colour from the standard colours to the sheet tab. Organization and Formatting a) Apply Arial font, size 10 to all data in the Table 1. b) Apply the currency style Ringgit Malaysia to Total columns. c) Apply blue, accent 1, lighter 40% for What-If assumption table background. Follow the direction a) Save file as Lab Test_Name (Matric ID). b) Submit softcopy in Ms Excel Format via E-learning
Step by Step Solution
There are 3 Steps involved in it

Get step-by-step solutions from verified subject matter experts