

Question: (Points: 10) In figure 5.1, the black area represents points that are classified as negative and the white area represents points that are classified as
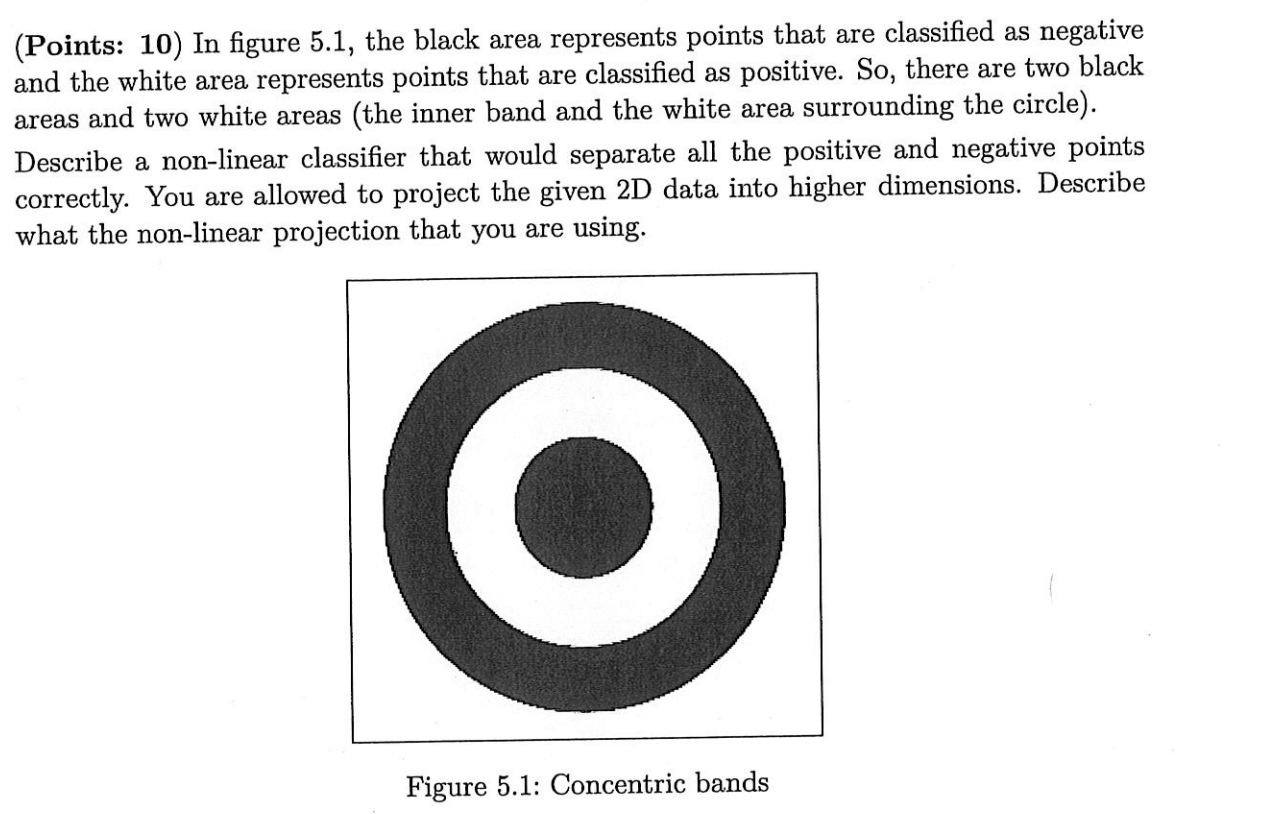
(Points: 10) In figure 5.1, the black area represents points that are classified as negative and the white area represents points that are classified as positive. So, there are two black areas and two white areas (the inner band and the white area surrounding the circle). Describe a non-linear classifier that would separate all the positive and negative points correctly. You are allowed to project the given 2D data into higher dimensions. Describe what the non-linear projection that you are using. Figure 5.1: Concentric bands
Step by Step Solution
There are 3 Steps involved in it
1 Expert Approved Answer
Step: 1 Unlock

Question Has Been Solved by an Expert!
Get step-by-step solutions from verified subject matter experts
Step: 2 Unlock
Step: 3 Unlock