

Question: point(s) possible SUDIn quiz Plan book The data given below show the number of overtime hours worked in one week per employee. Use the data

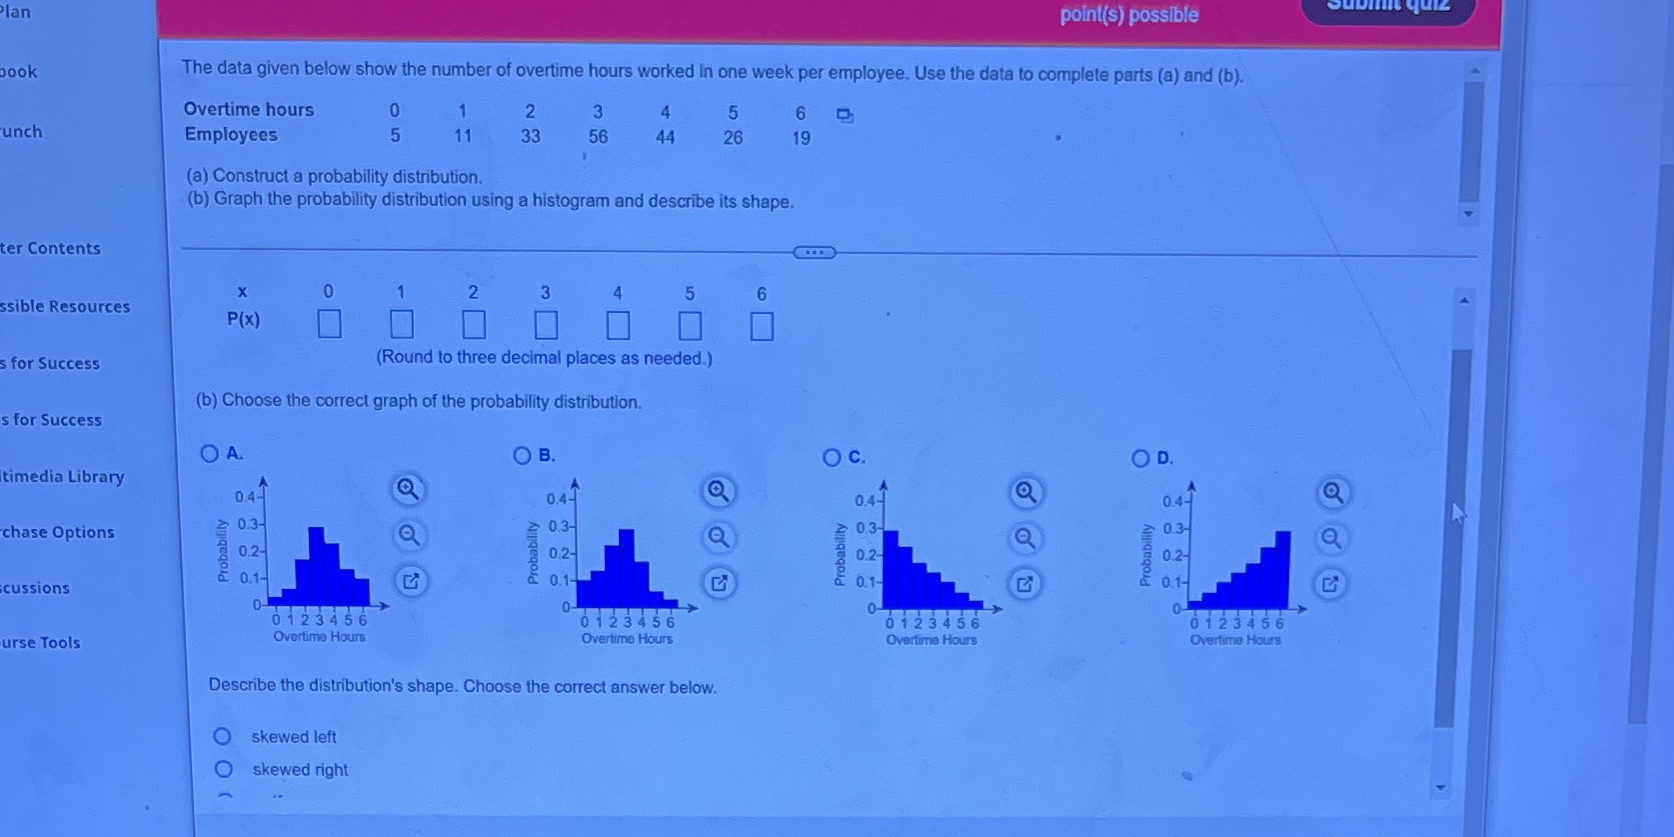
point(s) possible SUDIn quiz Plan book The data given below show the number of overtime hours worked in one week per employee. Use the data to complete parts (a) and (b). Overtime hours 2 3 5 6 unch Employees 11 33 56 44 26 19 (a) Construct a probability distribution. (b) Graph the probability distribution using a histogram and describe its shape. ter Contents X 5 6 ssible Resources P(x) s for Success (Round to three decimal places as needed.) (b) Choose the correct graph of the probability distribution. s for Success OA O B. Oc. O D. timedia Library 04-7 0.4-1 chase Options 03- 03- 0.3 Q 0.3- 0.2 0 2- 0.2- Probability 0.2- Probabil & 0.1 6 0.1- 0.1- 0.1- cussions 0- O- 0123456 0123456 0 123456 0123456 urse Tools Overtime Hours Overtime Hours Overtime Hours Overtime Hours Describe the distribution's shape. Choose the correct answer below. O skewed left O skewed right
Step by Step Solution
There are 3 Steps involved in it

Get step-by-step solutions from verified subject matter experts