

Question: Question 8 This Test: 39 pts possible {EB The data given below show the number of overtime hours worked in one week per employee Use
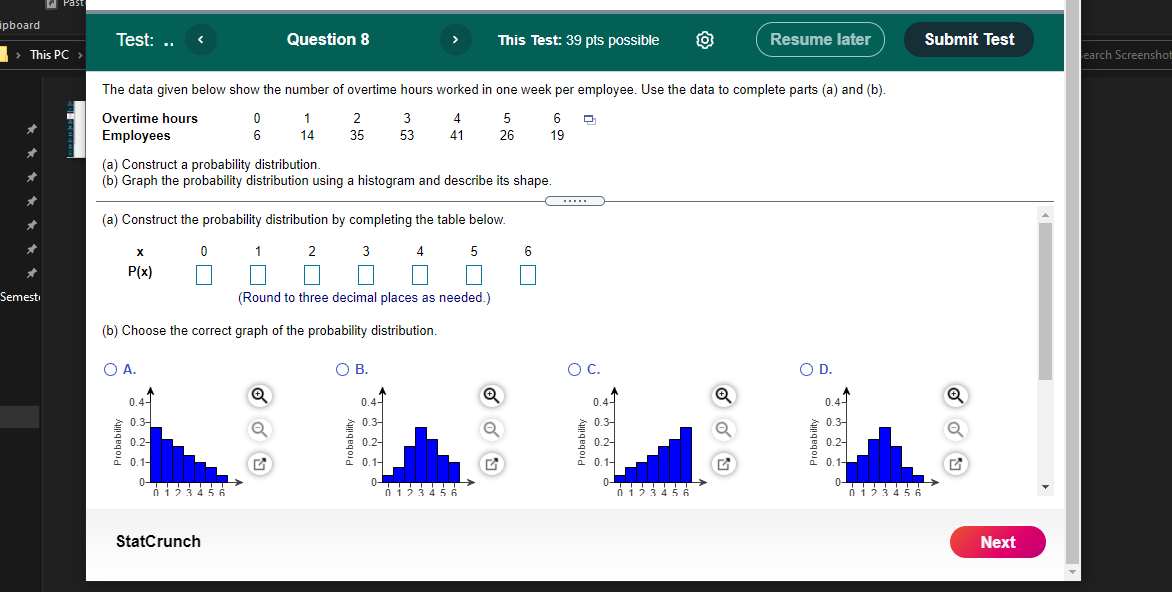
Question 8 This Test: 39 pts possible {EB The data given below show the number of overtime hours worked in one week per employee Use the data to complete parts (a) and (b). Overtime hours i] 1 2 3 4 5 6 l3 Employees 6 14 35 53 41 26 19 [a] Construct a probability distribution. [b] Graph the probability distribution using a histogram and describe its shape. Submit Test [a] Construct the probability distribution by completing the table below. x l] 1 2 3 =1 5 Pill (Round to three decimal places as needed.) [b] Choose the correct graph of the probabiliW,I distribution. 0 1:- O on O n O U .A .A .A .A a at Probability :- : c- 1: Probability :- : c- 1: Probability :- : c- 1:- Probability :- : c- n:- A . A . A . A . E': StatCrunch
Step by Step Solution
There are 3 Steps involved in it

Get step-by-step solutions from verified subject matter experts