

Question: Polymer Rheology For the capillary rheometry data given in Table Q4 plot a graph to evaluate the correction for entrance effects. (1psi=6.89103Pa)
Polymer Rheology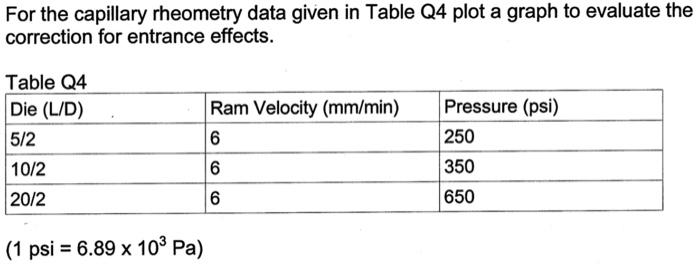
For the capillary rheometry data given in Table Q4 plot a graph to evaluate the correction for entrance effects. (1psi=6.89103Pa)
Step by Step Solution
There are 3 Steps involved in it
1 Expert Approved Answer
Step: 1 Unlock

Question Has Been Solved by an Expert!
Get step-by-step solutions from verified subject matter experts
Step: 2 Unlock
Step: 3 Unlock