

Question: POM+Project Project information as per below: The project team works eight-hour days, Monday through Friday The Project will begin on November 6, 2023 The following
POM+Project
Project information as per below:
- The project team works eight-hour days, Monday through Friday
- The Project will begin on November 6, 2023
- The following holidays are observed: Christmas Holiday Shutdown 25/12/23 to 05/01/2024, Auckland Anniversary Monday 29 January 2024, Waitangi Day 6 February 2024, Good Friday 29 March 2024, Easter Monday 1 April 2024, ANZAC day 25 April 2024, Kings Birthday Monday 3 June 2024
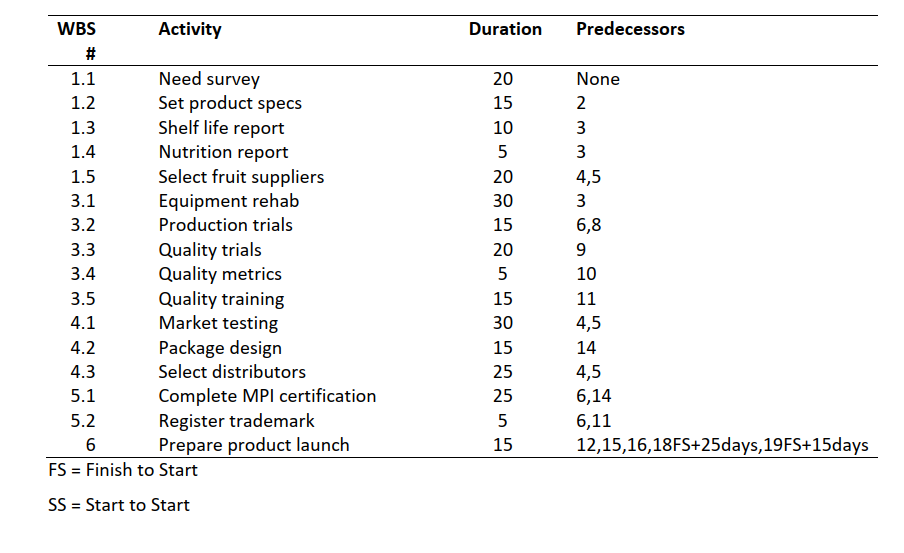
WBS and Details:
The following are the resources and activity assigned for each resource from the case study.
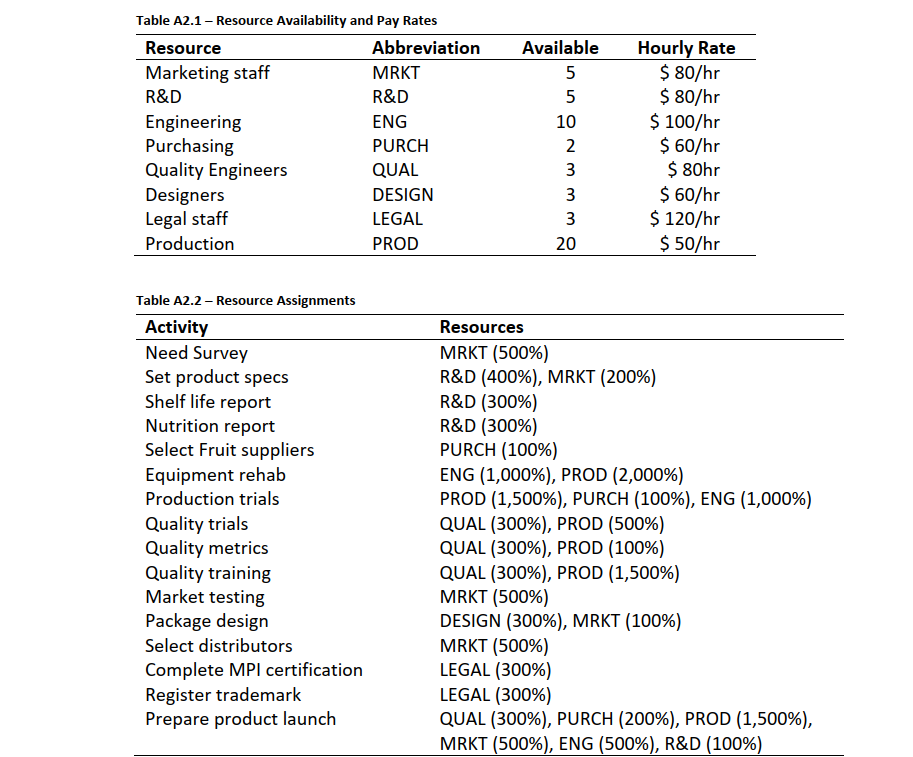
The below is extracted/prepared in ms projects file with the above information from case study
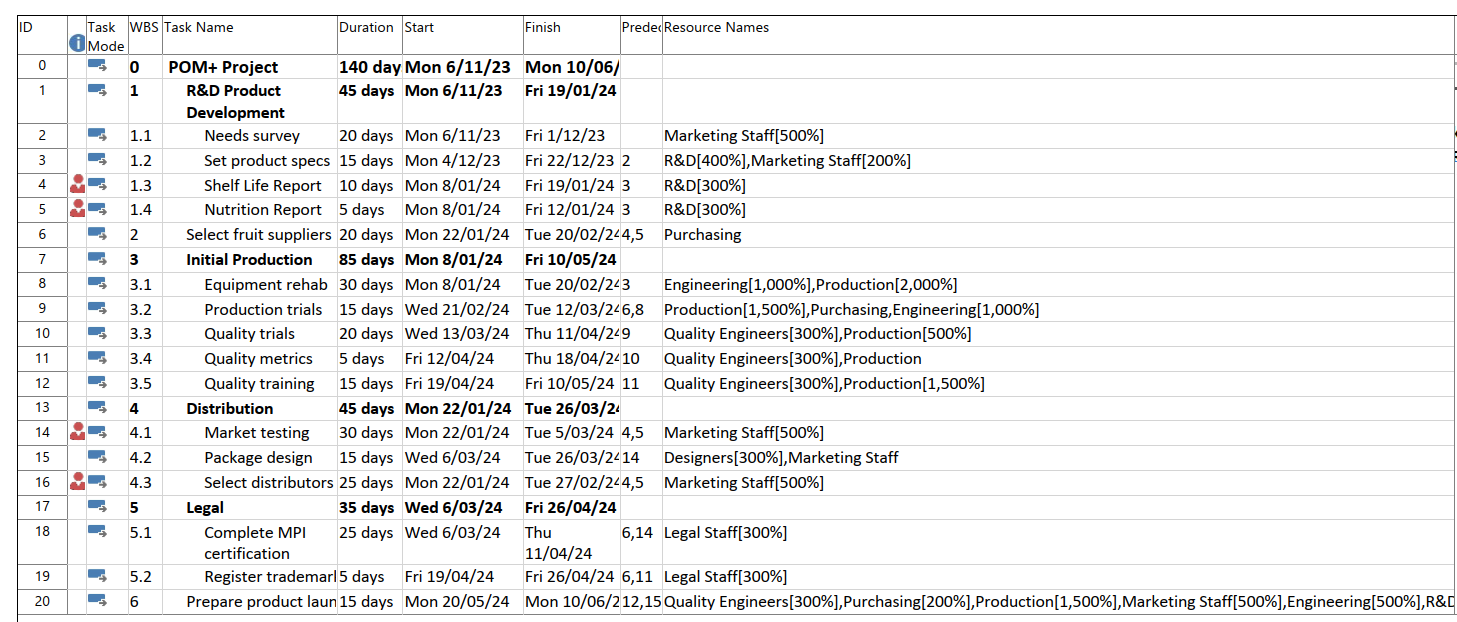
There are 2 resources that are over allocated (R&D and marketing staff) and 4 activities (Shelf life report, nutrition report, market testing and select distributors) that have resources over allocated.
Need assistance with detailed analysis and explanation to the following questions:
- For each resource that is over allocated, explain when and by how much they are over allocated
- Resource graph to show the over allocation for each activity and by how many percentage or duration with an explanation
- Assume that the project is time constrained and try to resolve any over allocation problems by levelling within slack. Give a detailed report of what happens? (note: the project duration should still be 140 days when once you have levelled inside of slack)
- What is the impact of levelling within slack on the sensitivity of the network? Explain what this is?
- Assume the project is resource constrained and resolve any over allocation by levelling outside of slack. Give a detailed report of what happens?
\begin{tabular}{rlcl} \hline \begin{tabular}{r} WBS \\ # \end{tabular} & Activity & Duration & Predecessors \\ \hline 1.1 & Need survey & 20 & None \\ 1.2 & Set product specs & 15 & 2 \\ 1.3 & Shelf life report & 10 & 3 \\ 1.4 & Nutrition report & 5 & 3 \\ 1.5 & Select fruit suppliers & 20 & 4,5 \\ 3.1 & Equipment rehab & 30 & 3 \\ 3.2 & Production trials & 15 & 6,8 \\ 3.3 & Quality trials & 20 & 9 \\ 3.4 & Quality metrics & 5 & 10 \\ 3.5 & Quality training & 15 & 11 \\ 4.1 & Market testing & 30 & 4,5 \\ 4.2 & Package design & 15 & 14 \\ 4.3 & Select distributors & 25 & 4,5 \\ 5.1 & Complete MPI certification & 25 & 6,14 \\ 5.2 & Register trademark & 5 & 6,11 \\ 6 & Prepare product launch & 15 & 12,15,16,18 FS +25days,19FS+15days \\ \hline FS = Finish to Start & & \\ SS = Start to Start & & \end{tabular} Table A2.1 - Resource Availability and Pay Rates Table A2.) - Resource Assionments
Step by Step Solution
There are 3 Steps involved in it

Get step-by-step solutions from verified subject matter experts