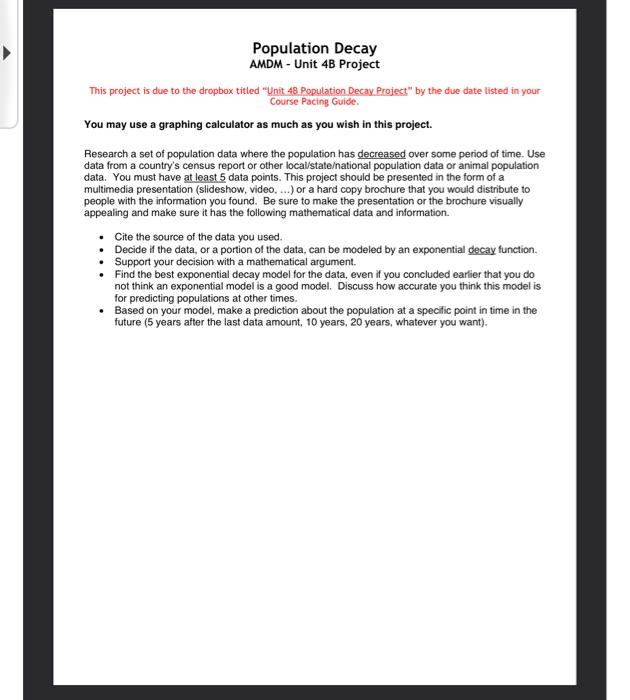
Question: Population Decay AMDM - Unit 4B Project This project is due to the dropbox titled Unit 48 Population Decay. Project by the due date listed

Population Decay AMDM - Unit 4B Project This
Population Decay AMDM - Unit 4B Project This project is due to the dropbox titled "Unit 48 Population Decay. Project" by the due date listed in your Course Pacing Guide, You may use a graphing calculator as much as you wish in this project. Research a set of population data where the population has decreased over some period of time. Use data from a country's census report or other local/stateational population data or animal population data. You must have at least 5 data points. This project should be presented in the form of a multimedia presentation (slideshow, video, ...) or a hard copy brochure that you would distribute to people with the information you found. Be sure to make the presentation or the brochure visually appealing and make sure it has the following mathematical data and information. . Cite the source of the data you used. Decide if the data, or a portion of the data can be modeled by an exponential decay function. Support your decision with a mathematical argument. Find the best exponential decay model for the data, even if you concluded earlier that you do not think an exponential model is a good model. Discuss how accurate you think this model is for predicting populations at other times. Based on your model make a prediction about the population at a specific point in time in the future (5 years after the last data amount, 10 years, 20 years, whatever you want). Population Decay AMDM - Unit 4B Project This project is due to the dropbox titled "Unit 48 Population Decay. Project" by the due date listed in your Course Pacing Guide, You may use a graphing calculator as much as you wish in this project. Research a set of population data where the population has decreased over some period of time. Use data from a country's census report or other local/stateational population data or animal population data. You must have at least 5 data points. This project should be presented in the form of a multimedia presentation (slideshow, video, ...) or a hard copy brochure that you would distribute to people with the information you found. Be sure to make the presentation or the brochure visually appealing and make sure it has the following mathematical data and information. . Cite the source of the data you used. Decide if the data, or a portion of the data can be modeled by an exponential decay function. Support your decision with a mathematical argument. Find the best exponential decay model for the data, even if you concluded earlier that you do not think an exponential model is a good model. Discuss how accurate you think this model is for predicting populations at other times. Based on your model make a prediction about the population at a specific point in time in the future (5 years after the last data amount, 10 years, 20 years, whatever you want)

Step by Step Solution

There are 3 Steps involved in it

1 Expert Approved Answer
Step: 1 Unlock blur-text-image
Question Has Been Solved by an Expert!

Get step-by-step solutions from verified subject matter experts

Step: 2 Unlock
Step: 3 Unlock

Students Have Also Explored These Related General Management Questions!