

Question: Portfolio analysis You have been given the expected return data shown in the first table on three assets - F, G, and H - over
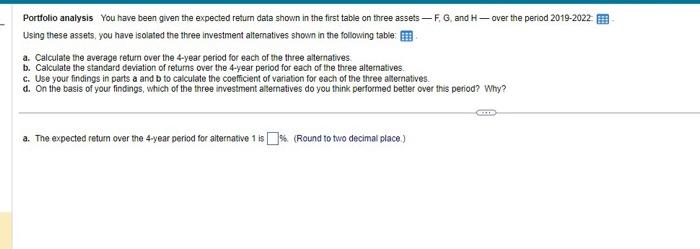
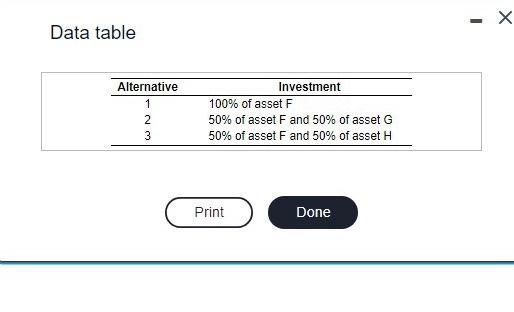
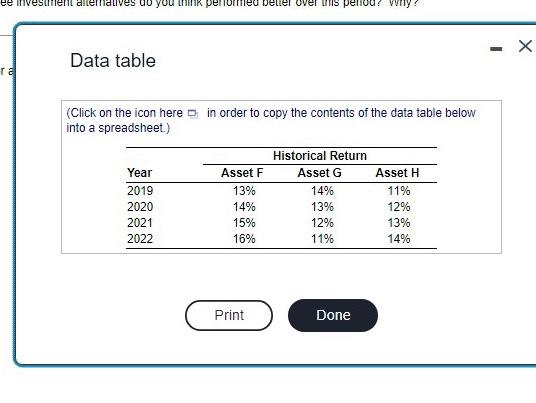
Portfolio analysis You have been given the expected return data shown in the first table on three assets - F, G, and H - over the period 20192022 Using these assets, you have isolated the three irvestment alternatives shown in the following table: a. Calculate the average retum over the 4-year period for each of the three alternatives. b. Calculate the standard deviation of retums over the 4 -year period for each of the three alternatives. c. Use your findings in parts a and b to calculate the coefficient of variation for each of the three allecnatives. d. On the basis of your findings, which of the three investment allematives do you think performed better over this period? Why? a. The expected return over the 4 -year period for alternative 1 is \%. (Round to two decimal place) Data table Data table (Click on the icon here in order to copy the contents of the data table below into a spreadsheet.)
Step by Step Solution
There are 3 Steps involved in it

Get step-by-step solutions from verified subject matter experts