

Question: Portfolio analysis You have been given the expected rolur Using these assets, you have bolted the three investment Data table - X a. Calculate the
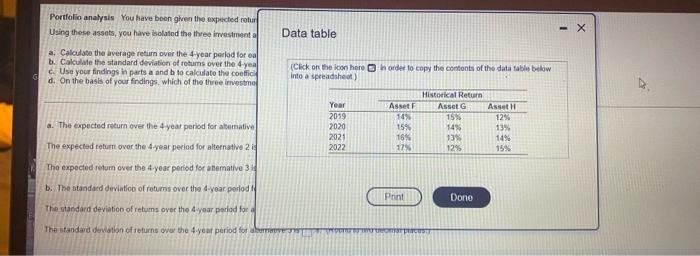
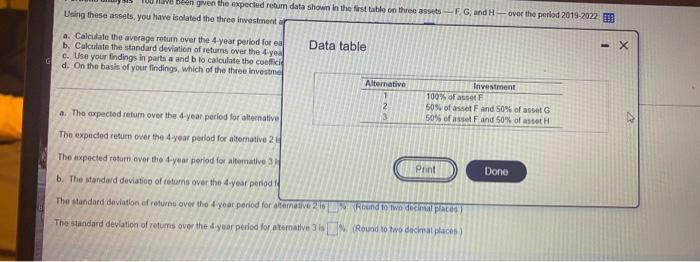
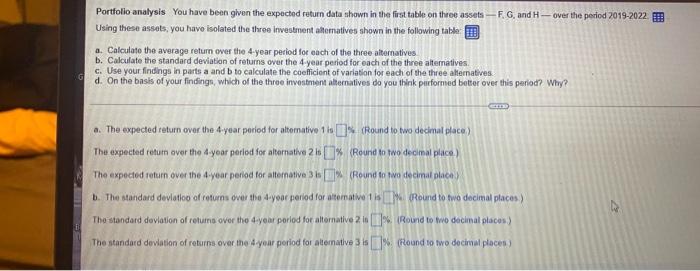
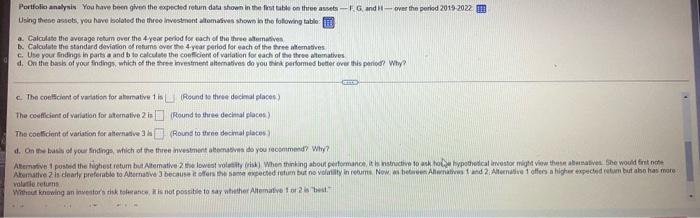
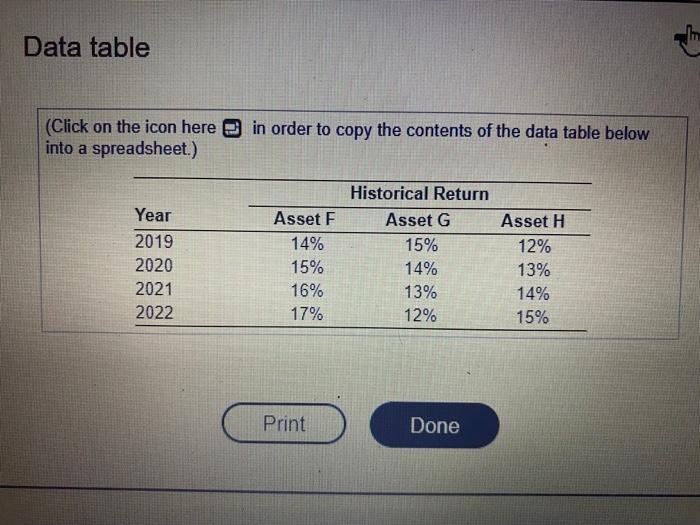
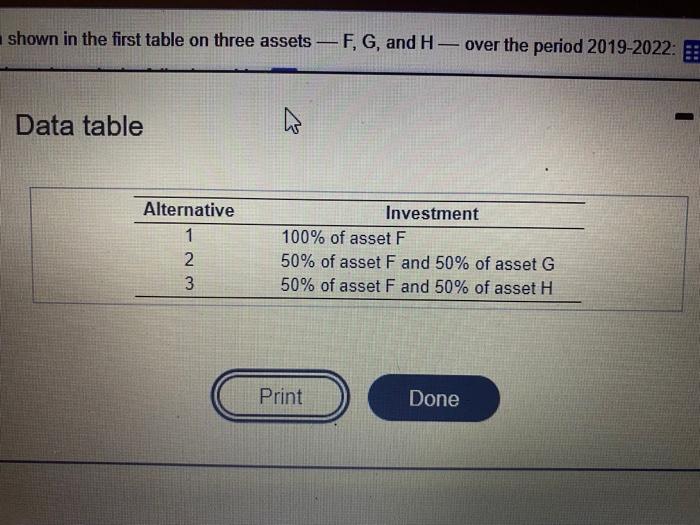
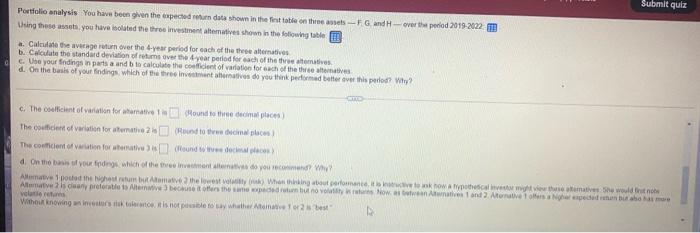
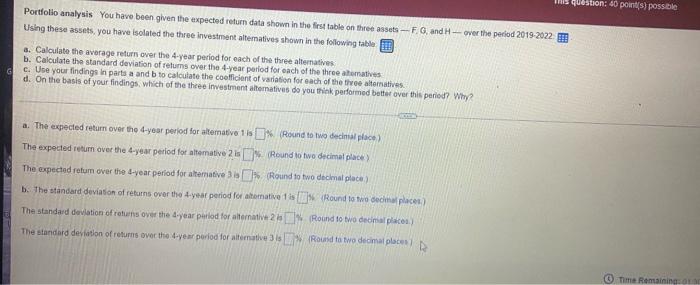
Portfolio analysis You have been given the expected rolur Using these assets, you have bolted the three investment Data table - X a. Calculate the average return over the 4-year period for a b. Calculate the standard deviation of returns over the 4 yea c. Use your findings in parts a and b to calculate the coeffic d. On the basis of your findings, which of the three investme (Click on the icon here order to copy the contents of the datatable below into a spreadsheet) a. The expected return over the 4-year period for alamative Year 2019 2020 2021 2022 Historical Return Asset Asset G Asset 14% 15% 12% 15% 14% 13% 16% 13% 14% 12% 129 15% The expected return over the year period for alternative 2 The expected return over the 4-year period for attemative 3 b. The standard deviation of returns over the year period Print Dono The standard deviation of returns over the 4 year period for The standard deviation of returns over the 4-year period for a TOTTICUS ve been given the expected return data shown in the first table on the asses-F. G. and H - over the period 2019-2022 Using these assets, you have isolated the three investment -X a. Calculate the average return over the 4-year period for a Data table b. Calculate the standard deviation of returns over the 4-yea c. Use your findings in parts a and b to calculate the coeffici d. On the basis of your findings which of the three investme Alternative Investment 100% of asset 50% of asset F and 50% of asset a. The expected return over the 4-year period for alternative 50% of asset F and 50% of tot The expected return over the year period for alternative 2 The expected return over the 4-year period for alterative 3 Pont Dono b. The standard deviatico of returns over the year period The standard deviation of returns over the year period for alternative 20 Round to two decimal pa The standard deviation of retums over the dyear period for tomative. (Round to wo dicha hace Portfolio analysis You have been given the expected return data shown in the first table on three assets -- F, G, and H - over the period 2019-2022 Using these assets, you have isolated the three Investment alhormatives shown in the following table a. Calculate the average return over the 4-year period for each of the three alternatives b. Calculate the standard deviation of returns over the 4-year period for each of the three alternatives c. Use your findings in parts a and b to calculate the coefficient of variation for each of the three alteratives d. On the basis of your findings, which of the three investment alternatives do you think performed better over this period? Why? Gm a. The expected return over the 4-year period for alternative to I (Round to two decimal place) The expected retum over the dyear period for alternative 20% (Round to two decimal place) The expected return over the 4-year period for alternative Round to two decimal place . The standard deviation of returns over the 4-year period for alternative is Round to two decimal places) The standard deviation of retums over the 4-year porlod for alternative 2.0 l. Round to wo decimal places) The standard deviation of returns over the your period for alternative 3D (Round to wo decimal place) Portfolio analysis. You have been given the expected retum data shown in the first table on threats -- Gandy -- ver the period 2019-2022 m Using the assets, you have lidated the theo Investment altomatives shown in the following table a. Calculate the average return over the year period for each of the three amatives b. Calculate the standard deviation of returns over the 4-year period for each of the realmatives c. Use your findings in partea and b to calculate the coeficient of variation for each of the three tematives d. On the base of your findings which of the three Investment alternatives do you think performed beter over this period? Why? c. The coeficient of variation for alterative is Round a three decimal places The coefficient of variation for alternative 21- Round to three decimal places) The coefficient of variation for alternative Round to the decimal places d. On the basis of your indings, which of the three investment and you recommend? Why? Abernative posted the highest retum butAtemative lowest volly When thinking about performances and took toe hypothetical investor mit View these bave she would rath Alternative is clearly preferable to Alternative because offers acted totum but no vality in retums. Now sb Anuntiand 2 Alternate 1 offers a higher expected return but he has more walathe returns Without knowing an investors that is not possible to say whither Allem 102 Data table (Click on the icon here into a spreadsheet.) in order to copy the contents of the data table below Year 2019 2020 2021 2022 Asset F 14% 15% 16% 17% Historical Return Asset G 15% 14% 13% 12% Asset H 12% 13% 14% 15% Print Done shown in the first table on three assets F, G, and H-over the period 2019-2022: : 1 Data table Alternative 1 2 3 Investment 100% of asset F 50% of asset F and 50% of asset G 50% of asset F and 50% of asset H WN C Print Done Submit quiz Portfolio analysis You have been given the expected return data shown in the finale co the wes-FGH-over the period 2019-2022 T Using these are you have bolted the three investment atematives shown in the following title # Calculate the average return over the 4-year period for each of the these mais 6. Calculate the standard deviation of return over the year period for each of the true tomatives c. Use your indings in parts and to calculate the confident of variation for each of the three statives d. On the basis of your findings which of the three inventatives do you think performed better over this period? Why? TE c. The ellicent of variation for whamative Hound to the decimal places The count of variation for the 25 Round to the malce The concient of cation for travel Woundedeco d. On the basis of your findings which of the then do you can Amatve 1 podled the che tuttomate the lowest) Whething to promote think how the cathematies would be no Alematis dan berat Alive bestowed to wastewatives and 2. Arnave seen but she voltas Without knowing wink to its not possible to say whether Atena 12 This question: 40 points possible Portfolio analysis You have been given the expected return data shown in the first table on three assets - F G and H - over the period 2019-2022 Using these assets, you have isolated the three investment alteratives shown in the following table a. Calculate the average return over the 4-year period for each of the three alternatives b. Calculate the standard deviation of retums over the 4-year period for each of the three amaties c. Use your findings in parts a and b to calculate the coolicient of variation for each of the three alternatives d. On the basis of your findings which of the three investment alteratives do you think performed better over this period? Why? a. The expected retum over the 4-year period for alternative 1s Round to two decimal place) The expected return over the 4-year period for alternative 2. Round to two decimal place The expected retum overtise 4-year period for alternative 3% (Round to two decimal place b. The standard deviation of returns over the 4-yeat period for sternative Round to two godina place The standard deviation of returns over the 4-year period for alternative Round to two decimal place) The standard deviation of returns over the year period for alternative Round to two decimal places Time Remaining
Step by Step Solution
There are 3 Steps involved in it

Get step-by-step solutions from verified subject matter experts