

Question: Portfolio analysis You have been given the expected return data shown in the first table on three assets F, G, and H over the period
Portfolio analysisYou have been given the expected return data shown in the first table on three assets F, G, and H over the period 2019-2022: table
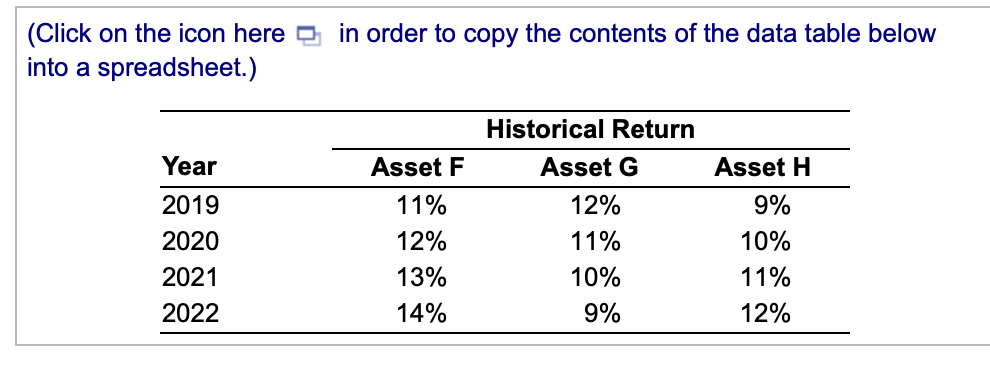
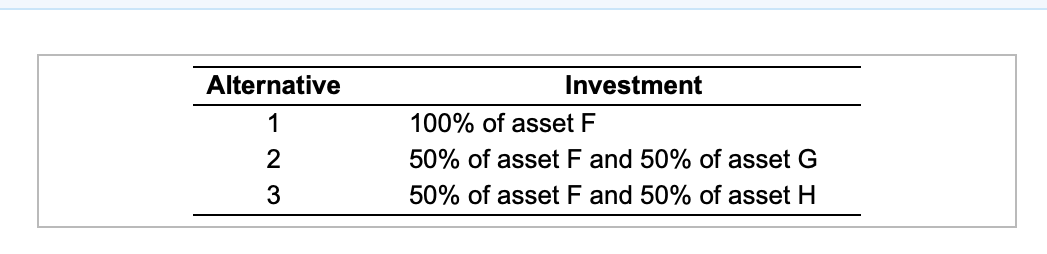
(Click on the icon here I: in order to copy the contents of the data table below into a spreadsheet.) Historical Return Year Asset F Asset (3 Asset H 2019 1 1 % 12% 9% 2020 12% 1 1 % 10% 2021 13% 10% 1 1 % 2022 14% 9% 12% Alternative Investment 1 100% of asset F 2 50% of asset F and 50% of asset G 3 50% of asset F and 50% of asset H
Step by Step Solution
There are 3 Steps involved in it
1 Expert Approved Answer
Step: 1 Unlock

Question Has Been Solved by an Expert!
Get step-by-step solutions from verified subject matter experts
Step: 2 Unlock
Step: 3 Unlock