

Question: Portfolio Assignment (Due 5/1/2020 at 11:59 p.m.) 20 points Using the data from Chapter 1 for Large Stocks and Long-term U.S. Government bonds, calculate: 1)

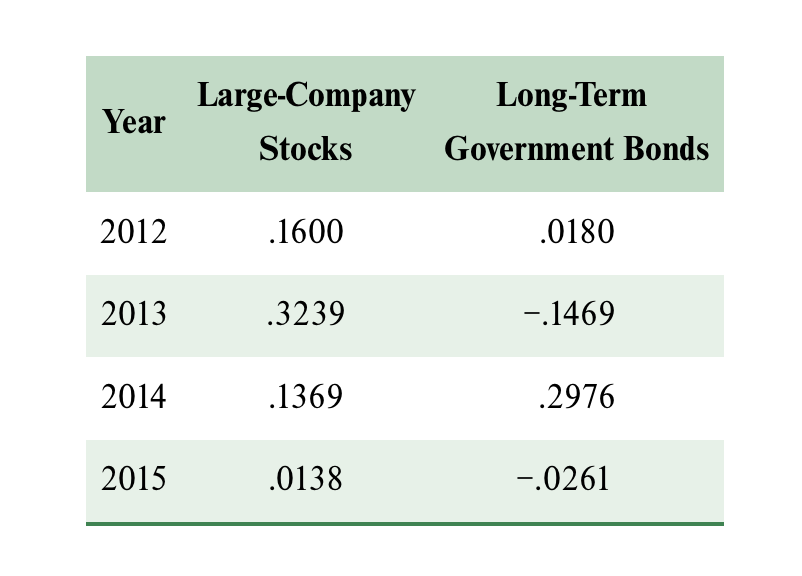
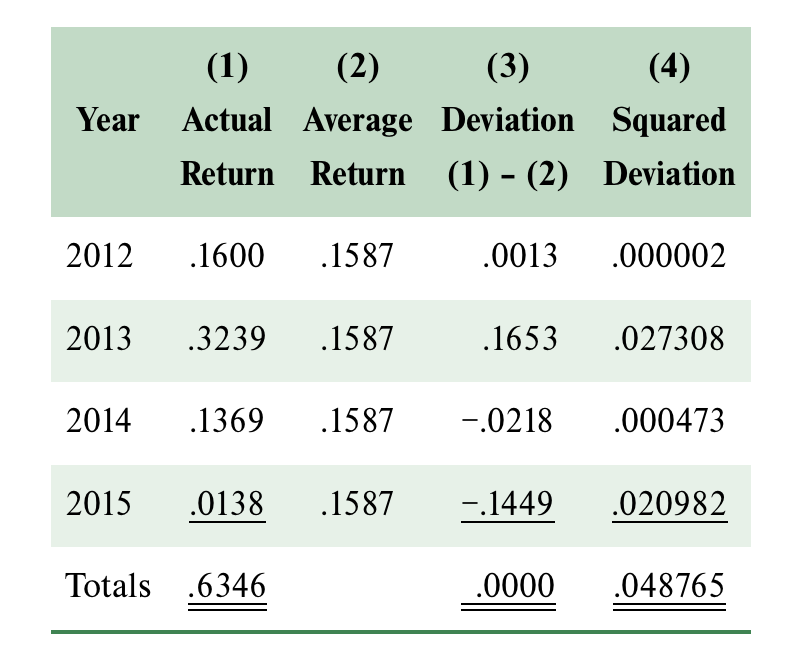
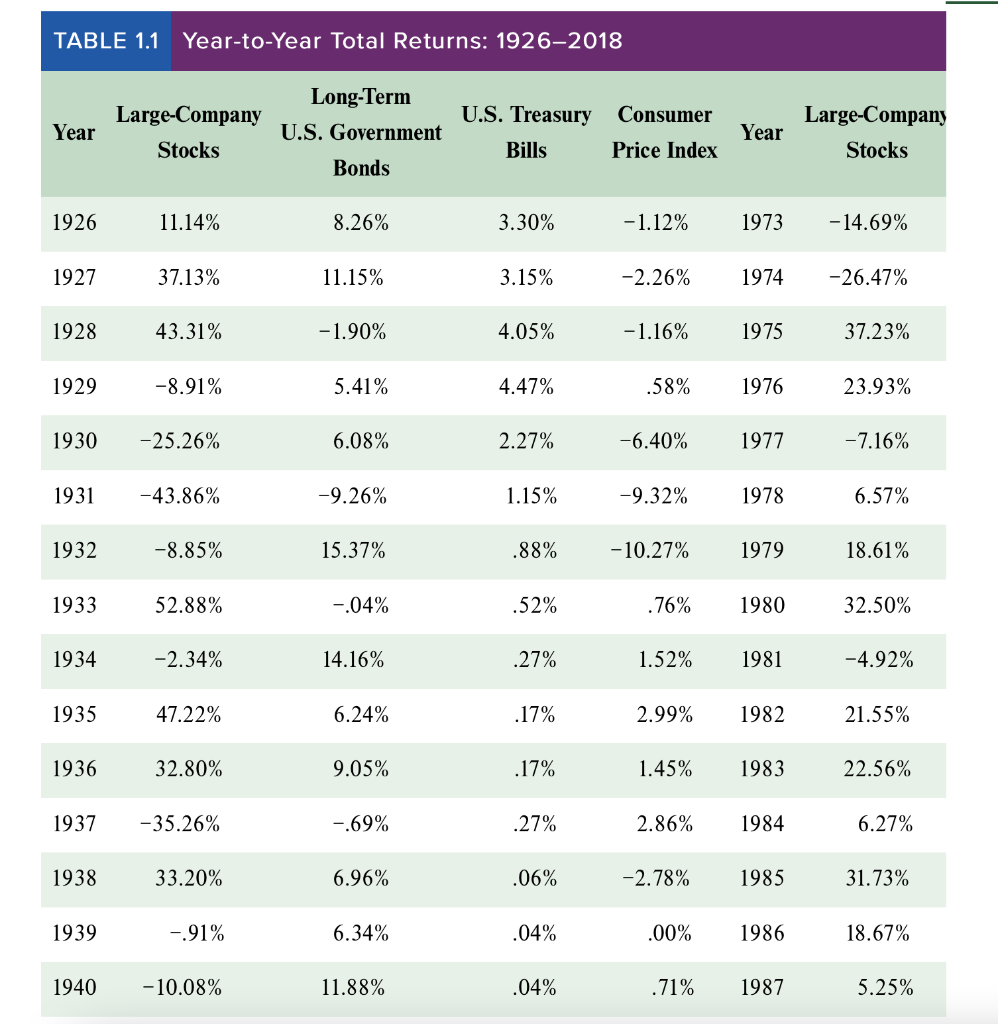
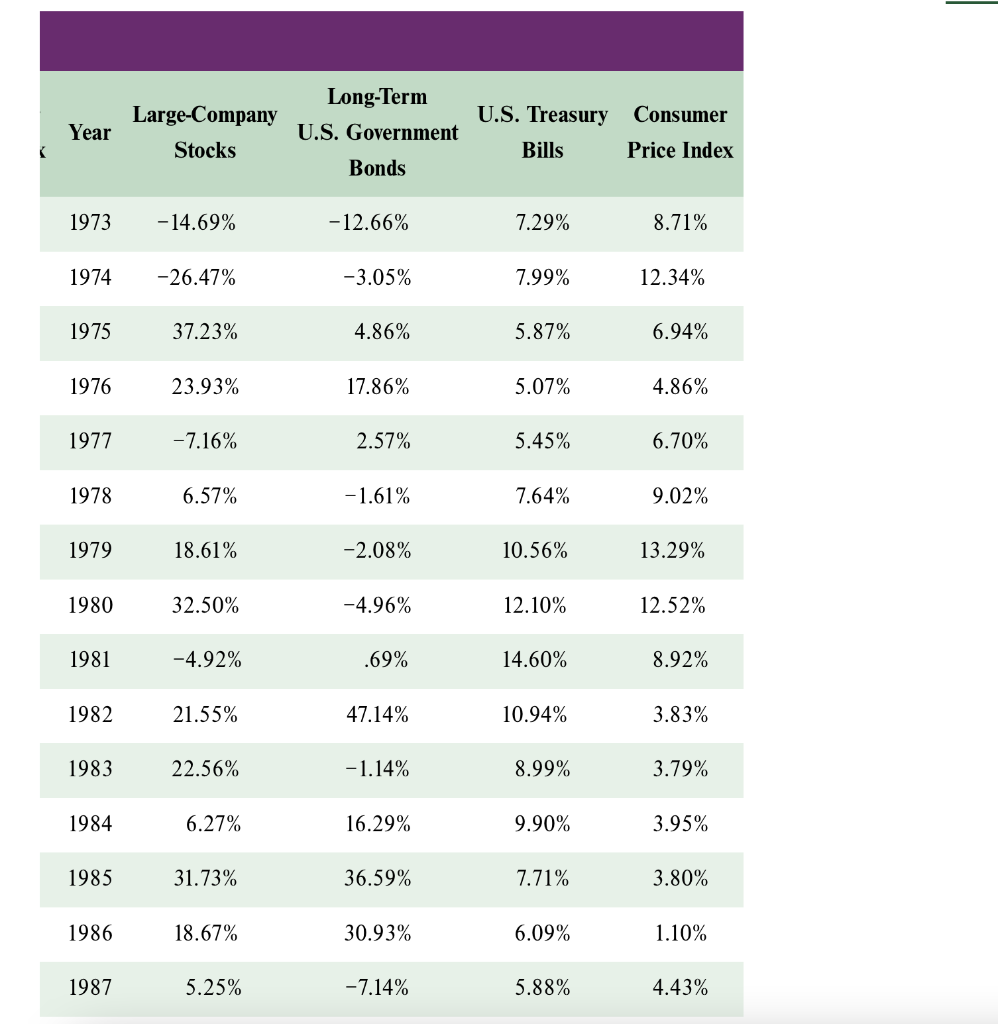
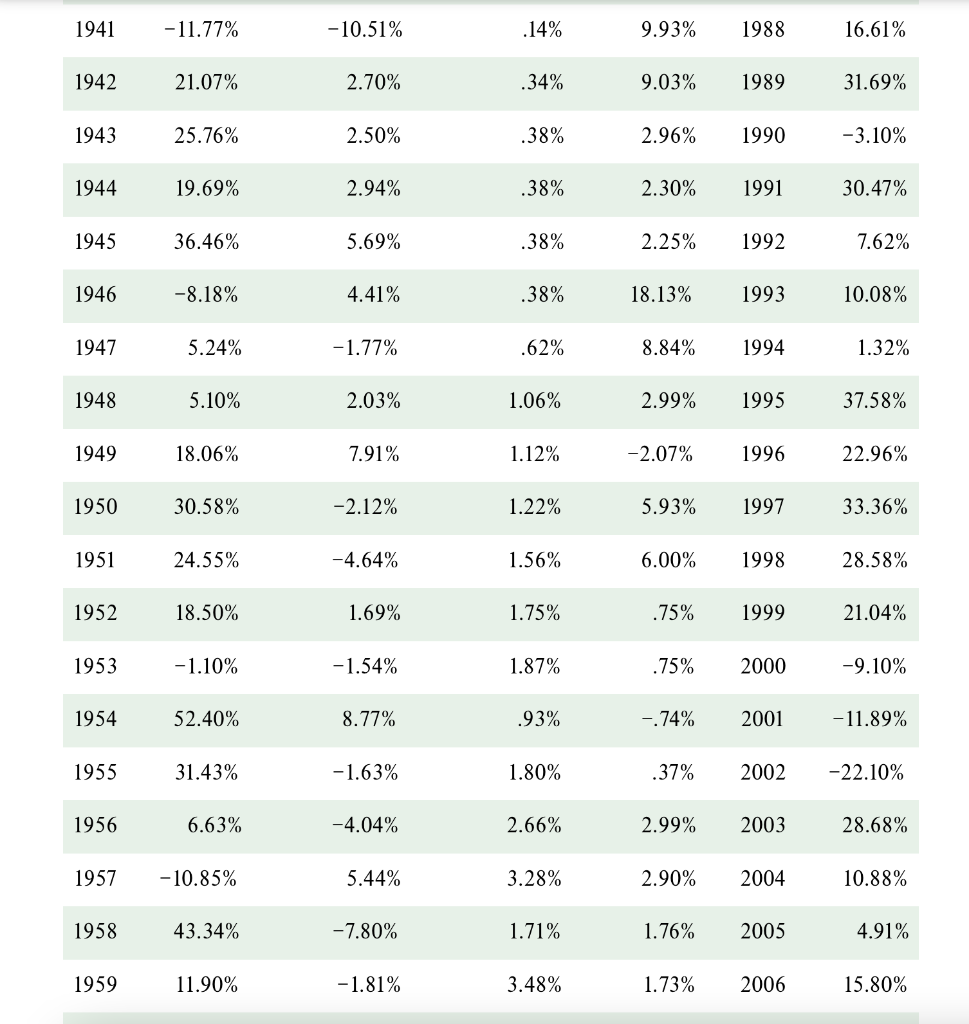
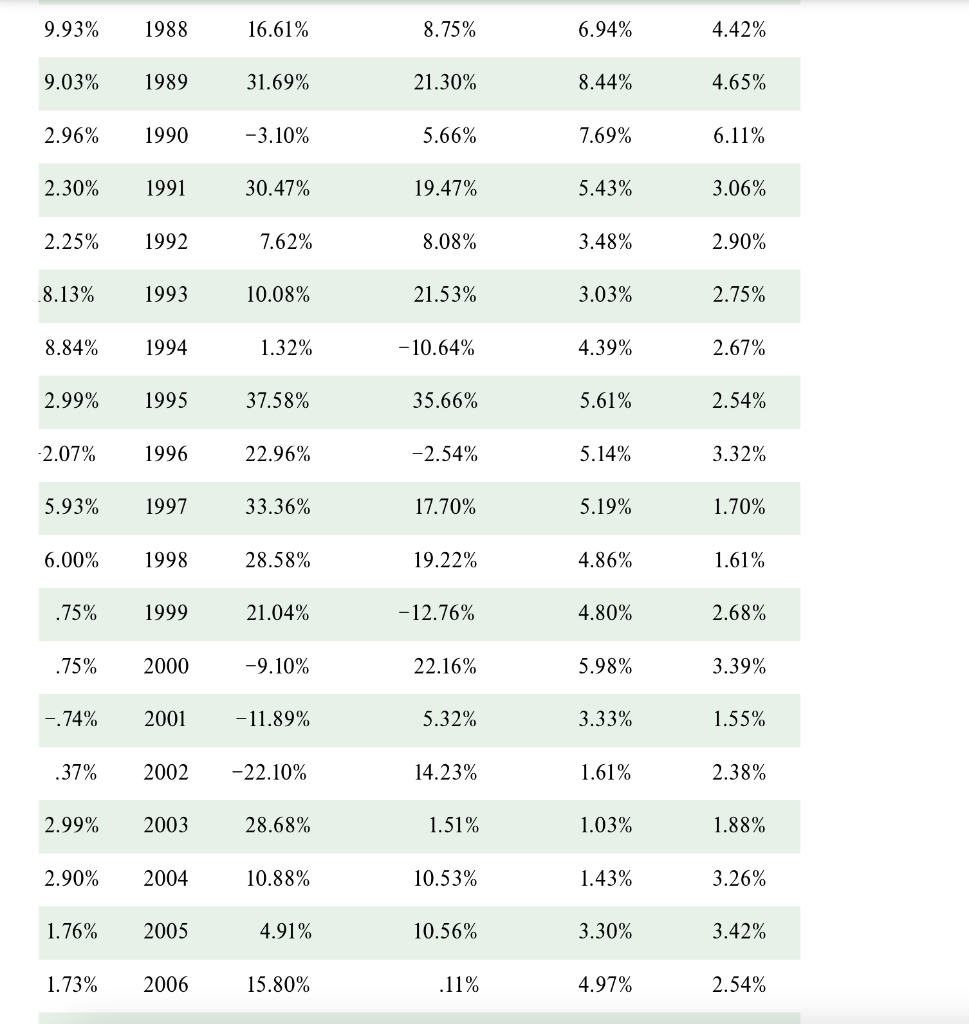
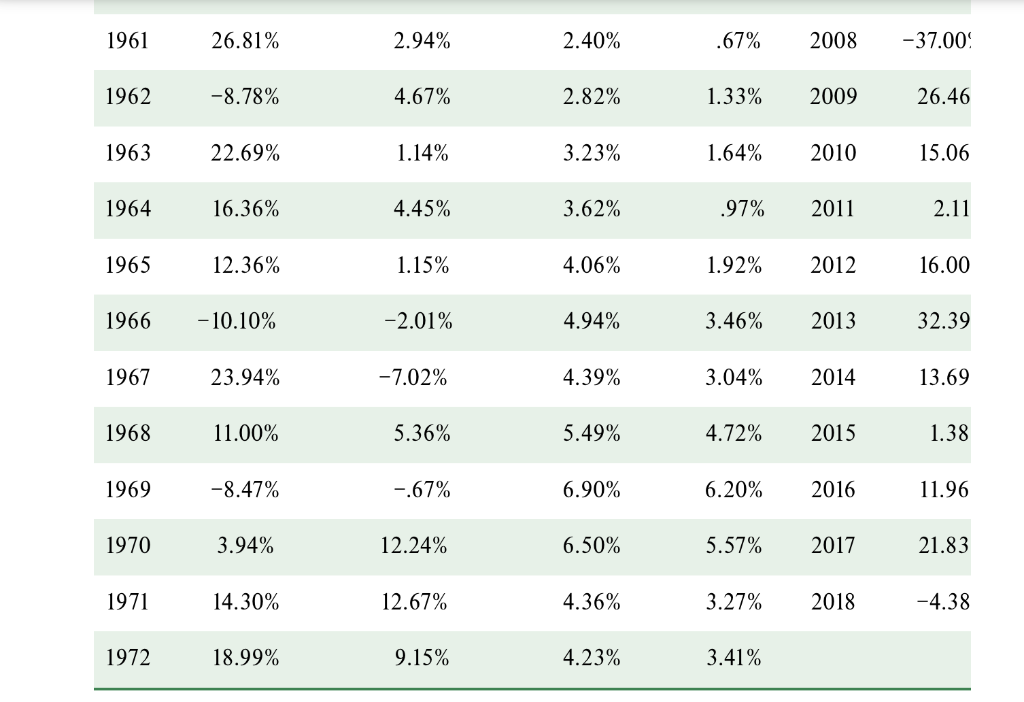
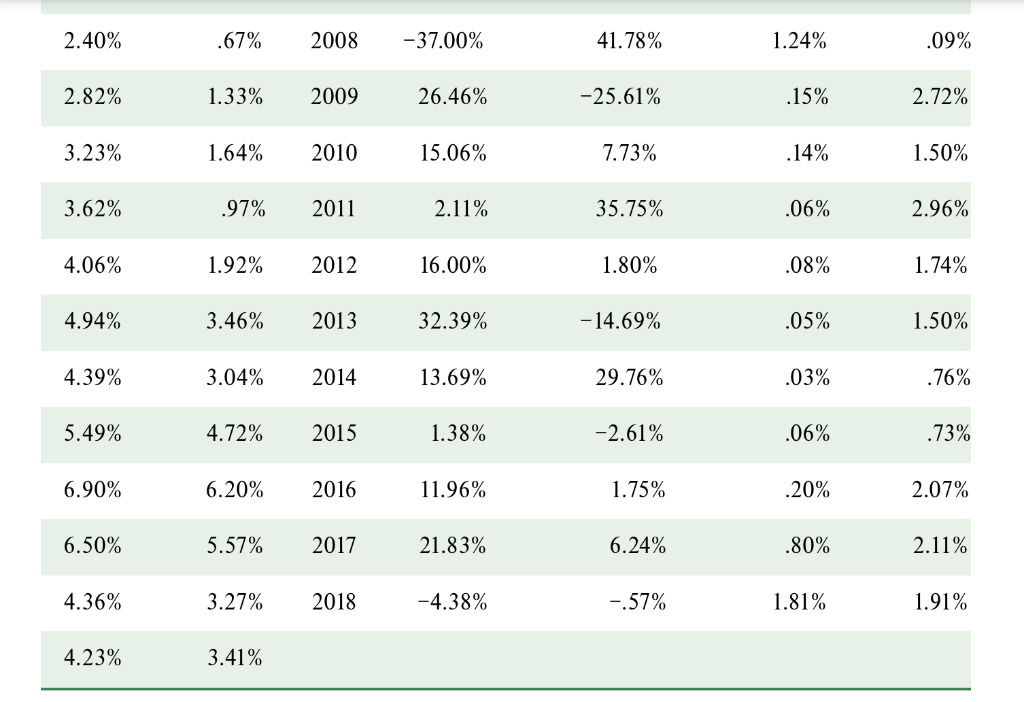
Portfolio Assignment (Due 5/1/2020 at 11:59 p.m.) 20 points Using the data from Chapter 1 for Large Stocks and Long-term U.S. Government bonds, calculate: 1) The expected return assuming that the past returns represent the expected future returns 2) Calculate the standard deviation of each portfolio 3) Calculate the expected return for a portfolio weight 50% in each security 4) Calculate the standard deviation of the portfolio from a combination of the two assets 5) Calculate the minimum variance portfolio for a combination of the two assets 6) Plot the efficient frontier including the minimum variance portfolio 7) Now assume there is a risk-free asset with a return of 3%. a. Create the new efficient frontier b. Identify the weights of the risky assets in the market portfolio C. Assume an investor has a coefficient of relative risk aversion of 15. Find the investors optimal complete portfolio. Year 2012 2013 2014 2015 Large-Company Stocks .1600 .3239 .1369 .0138 Long-Term Government Bonds .0180 -.1469 .2976 -.0261 (1) (2) (3) Year Actual Average Deviation 2012 .1600 .1587 2013 .3239 .1587 2014 .1369 .1587 2015 .0138 .1587 Totals .6346 (4) Squared Return Return (1)-(2) Deviation .0013 .000002 .1653 .027308 -.0218 .000473 -.1449 .020982 .0000 .048765 TABLE 1.1 Year-to-Year Total Returns: 1926-2018 Long-Term Large-Company U.S. Treasury Year U.S. Government Stocks Bills Bonds 1926 11.14% 8.26% 3.30% 1927 37.13% 11.15% 3.15% 1928 43.31% -1.90% 4.05% 1929 -8.91% 5.41% 4.47% 1930 -25.26% 6.08% 2.27% 1931 -43.86% -9.26% 1.15% 1932 -8.85% 15.37% .88% 1933 52.88% -.04% .52% 1934 -2.34% 14.16% .27% 1935 47.22% 6.24% .17% 1936 32.80% 9.05% .17% 1937 -35.26% -.69% .27% 1938 33.20% 6.96% .06% 1939 -.91% 6.34% .04% 1940 -10.08% 11.88% .04% Consumer Price Index -1.12% -2.26% - 1.16% .58% -6.40% -9.32% -10.27% Large-Company Year Stocks 1973 -14.69% 1974 -26.47% 1975 37.23% 1976 23.93% 1977 -7.16% 1978 6.57% 1979 18.61% .76% 1980 32.50% 1.52% 1981 -4.92% 2.99% 1982 21.55% 1.45% 1983 22.56% 2.86% 1984 6.27% -2.78% 1985 31.73% .00% 1986 18.67% .71% 1987 5.25% Large-Company Year Stocks 1973 -14.69% 1974 -26.47% 1975 37.23% 1976 23.93% 1977 -7.16% 1978 6.57% 1979 18.61% 1980 32.50% 1981 -4.92% 1982 21.55% 1983 22.56% 1984 6.27% 1985 31.73% 1986 18.67% 1987 5.25% Long-Term U.S. Government Bonds -12.66% -3.05% 4.86% 17.86% 2.57% -1.61% -2.08% -4.96% .69% 47.14% -1.14% 16.29% 36.59% 30.93% -7.14% U.S. Treasury Bills 7.29% 7.99% 5.87% 5.07% 5.45% 7.64% 10.56% 12.10% 14.60% 10.94% 8.99% 9.90% 7.71% 6.09% 5.88% Consumer Price Index 8.71% 12.34% 6.94% 4.86% 6.70% 9.02% 13.29% 12.52% 8.92% 3.83% 3.79% 3.95% 3.80% 1.10% 4.43% 1941 -11.77% 1942 21.07% 1943 25.76% 1944 19.69% 1945 36.46% 1946 -8.18% 1947 5.24% 1948 5.10% 1949 18.06% 1950 30.58% 1951 24.55% 1952 18.50% 1953 -1.10% 1954 52.40% 1955 31.43% 1956 6.63% 1957 -10.85% 1958 43.34% 1959 11.90% -10.51% 2.70% 2.50% 2.94% 5.69% 4.41% -1.77% 2.03% 7.91% -2.12% -4.64% 1.69% -1.54% 8.77% -1.63% -4.04% 5.44% -7.80% -1.81% .14% .34% .38% .38% .38% .38% .62% 1.06% 1.12% 1.22% 1.56% 1.75% 1.87% .93% 1.80% 2.66% 3.28% 1.71% 3.48% 9.93% 1988 9.03% 1989 2.96% 1990 2.30% 1991 2.25% 1992 18.13% 1993 8.84% 1994 2.99% 1995 -2.07% 1996 5.93% 1997 6.00% 1998 .75% 1999 .75% 2000 -.74% 2001 .37% 2002 2.99% 2003 2.90% 2004 1.76% 2005 1.73% 2006 16.61% 31.69% -3.10% 30.47% 7.62% 10.08% 1.32% 37.58% 22.96% 33.36% 28.58% 21.04% -9.10% -11.89% -22.10% 28.68% 10.88% 4.91% 15.80% 9.93% 1988 16.61% 9.03% 1989 31.69% 2.96% 1990 -3.10% 2.30% 1991 30.47% 2.25% 1992 7.62% 8.13% 1993 10.08% 8.84% 1994 1.32% 2.99% 1995 37.58% -2.07% 1996 22.96% 5.93% 1997 33.36% 6.00% 1998 28.58% .75% 1999 21.04% .75% 2000 -9.10% -.74% 2001 -11.89% .37% 2002 -22.10% 2.99% 2003 28.68% 2.90% 2004 10.88% 1.76% 2005 4.91% 1.73% 2006 15.80% 8.75% 21.30% 5.66% 19.47% 8.08% 21.53% -10.64% 35.66% -2.54% 17.70% 19.22% -12.76% 22.16% 5.32% 14.23% 1.51% 10.53% 10.56% .11% 6.94% 8.44% 7.69% 5.43% 3.48% 3.03% 4.39% 5.61% 5.14% 5.19% 4.86% 4.80% 5.98% 3.33% 1.61% 1.03% 1.43% 3.30% 4.97% 4.42% 4.65% 6.11% 3.06% 2.90% 2.75% 2.67% 2.54% 3.32% 1.70% 1.61% 2.68% 3.39% 1.55% 2.38% 1.88% 3.26% 3.42% 2.54% 1961 26.81% 1962 -8.78% 1963 22.69% 1964 16.36% 1965 12.36% 1966 -10.10% 1967 23.94% 1968 11.00% 1969 -8.47% 1970 3.94% 1971 14.30% 1972 18.99% 2.94% 4.67% 1.14% 4.45% 1.15% -2.01% -7.02% 5.36% -.67% 12.24% 12.67% 9.15% 2.40% 2.82% 3.23% 3.62% 4.06% 4.94% 4.39% 5.49% 6.90% 6.50% 4.36% 4.23% .67% 2008 1.33% 2009 1.64% 2010 .97% 2011 1.92% 2012 3.46% 2013 3.04% 2014 4.72% 2015 6.20% 2016 5.57% 2017 3.27% 2018 3.41% -37.00 26.46 15.06 2.11 16.00 32.39 13.69 1.38 11.96 21.83 -4.38 2.40% 2.82% 3.23% 3.62% 4.06% 4.94% 4.39% 5.49% 6.90% 6.50% 4.36% 4.23% .67% 2008 1.33% 2009 1.64% 2010 .97% 2011 1.92% 2012 3.46% 2013 3.04% 2014 4.72% 2015 6.20% 2016 5.57% 2017 3.27% 2018 3.41% -37.00% 26.46% 15.06% 2.11% 16.00% 32.39% 13.69% 1.38% 11.96% 21.83% -4.38% 41.78% -25.61% 7.73% 35.75% 1.80% -14.69% 29.76% -2.61% 1.75% 6.24% -.57% 1.24% .15% .14% .06% .08% .05% .03% .06% .20% .80% 1.81% .09% 2.72% 1.50% 2.96% 1.74% 1.50% .76% .73% 2.07% 2.11% 1.91% Portfolio Assignment (Due 5/1/2020 at 11:59 p.m.) 20 points Using the data from Chapter 1 for Large Stocks and Long-term U.S. Government bonds, calculate: 1) The expected return assuming that the past returns represent the expected future returns 2) Calculate the standard deviation of each portfolio 3) Calculate the expected return for a portfolio weight 50% in each security 4) Calculate the standard deviation of the portfolio from a combination of the two assets 5) Calculate the minimum variance portfolio for a combination of the two assets 6) Plot the efficient frontier including the minimum variance portfolio 7) Now assume there is a risk-free asset with a return of 3%. a. Create the new efficient frontier b. Identify the weights of the risky assets in the market portfolio C. Assume an investor has a coefficient of relative risk aversion of 15. Find the investors optimal complete portfolio. Year 2012 2013 2014 2015 Large-Company Stocks .1600 .3239 .1369 .0138 Long-Term Government Bonds .0180 -.1469 .2976 -.0261 (1) (2) (3) Year Actual Average Deviation 2012 .1600 .1587 2013 .3239 .1587 2014 .1369 .1587 2015 .0138 .1587 Totals .6346 (4) Squared Return Return (1)-(2) Deviation .0013 .000002 .1653 .027308 -.0218 .000473 -.1449 .020982 .0000 .048765 TABLE 1.1 Year-to-Year Total Returns: 1926-2018 Long-Term Large-Company U.S. Treasury Year U.S. Government Stocks Bills Bonds 1926 11.14% 8.26% 3.30% 1927 37.13% 11.15% 3.15% 1928 43.31% -1.90% 4.05% 1929 -8.91% 5.41% 4.47% 1930 -25.26% 6.08% 2.27% 1931 -43.86% -9.26% 1.15% 1932 -8.85% 15.37% .88% 1933 52.88% -.04% .52% 1934 -2.34% 14.16% .27% 1935 47.22% 6.24% .17% 1936 32.80% 9.05% .17% 1937 -35.26% -.69% .27% 1938 33.20% 6.96% .06% 1939 -.91% 6.34% .04% 1940 -10.08% 11.88% .04% Consumer Price Index -1.12% -2.26% - 1.16% .58% -6.40% -9.32% -10.27% Large-Company Year Stocks 1973 -14.69% 1974 -26.47% 1975 37.23% 1976 23.93% 1977 -7.16% 1978 6.57% 1979 18.61% .76% 1980 32.50% 1.52% 1981 -4.92% 2.99% 1982 21.55% 1.45% 1983 22.56% 2.86% 1984 6.27% -2.78% 1985 31.73% .00% 1986 18.67% .71% 1987 5.25% Large-Company Year Stocks 1973 -14.69% 1974 -26.47% 1975 37.23% 1976 23.93% 1977 -7.16% 1978 6.57% 1979 18.61% 1980 32.50% 1981 -4.92% 1982 21.55% 1983 22.56% 1984 6.27% 1985 31.73% 1986 18.67% 1987 5.25% Long-Term U.S. Government Bonds -12.66% -3.05% 4.86% 17.86% 2.57% -1.61% -2.08% -4.96% .69% 47.14% -1.14% 16.29% 36.59% 30.93% -7.14% U.S. Treasury Bills 7.29% 7.99% 5.87% 5.07% 5.45% 7.64% 10.56% 12.10% 14.60% 10.94% 8.99% 9.90% 7.71% 6.09% 5.88% Consumer Price Index 8.71% 12.34% 6.94% 4.86% 6.70% 9.02% 13.29% 12.52% 8.92% 3.83% 3.79% 3.95% 3.80% 1.10% 4.43% 1941 -11.77% 1942 21.07% 1943 25.76% 1944 19.69% 1945 36.46% 1946 -8.18% 1947 5.24% 1948 5.10% 1949 18.06% 1950 30.58% 1951 24.55% 1952 18.50% 1953 -1.10% 1954 52.40% 1955 31.43% 1956 6.63% 1957 -10.85% 1958 43.34% 1959 11.90% -10.51% 2.70% 2.50% 2.94% 5.69% 4.41% -1.77% 2.03% 7.91% -2.12% -4.64% 1.69% -1.54% 8.77% -1.63% -4.04% 5.44% -7.80% -1.81% .14% .34% .38% .38% .38% .38% .62% 1.06% 1.12% 1.22% 1.56% 1.75% 1.87% .93% 1.80% 2.66% 3.28% 1.71% 3.48% 9.93% 1988 9.03% 1989 2.96% 1990 2.30% 1991 2.25% 1992 18.13% 1993 8.84% 1994 2.99% 1995 -2.07% 1996 5.93% 1997 6.00% 1998 .75% 1999 .75% 2000 -.74% 2001 .37% 2002 2.99% 2003 2.90% 2004 1.76% 2005 1.73% 2006 16.61% 31.69% -3.10% 30.47% 7.62% 10.08% 1.32% 37.58% 22.96% 33.36% 28.58% 21.04% -9.10% -11.89% -22.10% 28.68% 10.88% 4.91% 15.80% 9.93% 1988 16.61% 9.03% 1989 31.69% 2.96% 1990 -3.10% 2.30% 1991 30.47% 2.25% 1992 7.62% 8.13% 1993 10.08% 8.84% 1994 1.32% 2.99% 1995 37.58% -2.07% 1996 22.96% 5.93% 1997 33.36% 6.00% 1998 28.58% .75% 1999 21.04% .75% 2000 -9.10% -.74% 2001 -11.89% .37% 2002 -22.10% 2.99% 2003 28.68% 2.90% 2004 10.88% 1.76% 2005 4.91% 1.73% 2006 15.80% 8.75% 21.30% 5.66% 19.47% 8.08% 21.53% -10.64% 35.66% -2.54% 17.70% 19.22% -12.76% 22.16% 5.32% 14.23% 1.51% 10.53% 10.56% .11% 6.94% 8.44% 7.69% 5.43% 3.48% 3.03% 4.39% 5.61% 5.14% 5.19% 4.86% 4.80% 5.98% 3.33% 1.61% 1.03% 1.43% 3.30% 4.97% 4.42% 4.65% 6.11% 3.06% 2.90% 2.75% 2.67% 2.54% 3.32% 1.70% 1.61% 2.68% 3.39% 1.55% 2.38% 1.88% 3.26% 3.42% 2.54% 1961 26.81% 1962 -8.78% 1963 22.69% 1964 16.36% 1965 12.36% 1966 -10.10% 1967 23.94% 1968 11.00% 1969 -8.47% 1970 3.94% 1971 14.30% 1972 18.99% 2.94% 4.67% 1.14% 4.45% 1.15% -2.01% -7.02% 5.36% -.67% 12.24% 12.67% 9.15% 2.40% 2.82% 3.23% 3.62% 4.06% 4.94% 4.39% 5.49% 6.90% 6.50% 4.36% 4.23% .67% 2008 1.33% 2009 1.64% 2010 .97% 2011 1.92% 2012 3.46% 2013 3.04% 2014 4.72% 2015 6.20% 2016 5.57% 2017 3.27% 2018 3.41% -37.00 26.46 15.06 2.11 16.00 32.39 13.69 1.38 11.96 21.83 -4.38 2.40% 2.82% 3.23% 3.62% 4.06% 4.94% 4.39% 5.49% 6.90% 6.50% 4.36% 4.23% .67% 2008 1.33% 2009 1.64% 2010 .97% 2011 1.92% 2012 3.46% 2013 3.04% 2014 4.72% 2015 6.20% 2016 5.57% 2017 3.27% 2018 3.41% -37.00% 26.46% 15.06% 2.11% 16.00% 32.39% 13.69% 1.38% 11.96% 21.83% -4.38% 41.78% -25.61% 7.73% 35.75% 1.80% -14.69% 29.76% -2.61% 1.75% 6.24% -.57% 1.24% .15% .14% .06% .08% .05% .03% .06% .20% .80% 1.81% .09% 2.72% 1.50% 2.96% 1.74% 1.50% .76% .73% 2.07% 2.11% 1.91%
Step by Step Solution
There are 3 Steps involved in it

Get step-by-step solutions from verified subject matter experts