

Question: Post Published MATLAB Solution and graph as well The following data gives the height (in inches) of a sunflower plant as a function of time
Post Published MATLAB Solution and graph as well
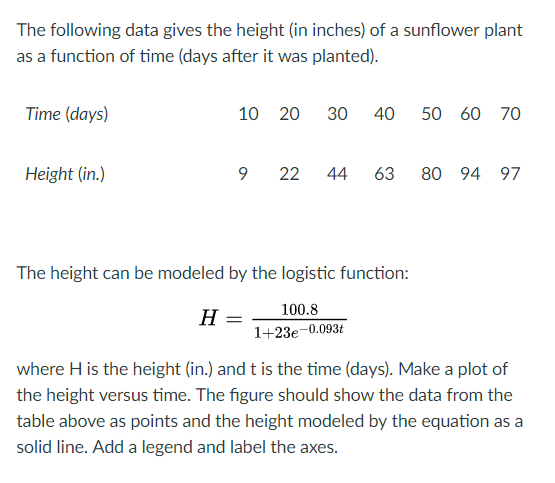
The following data gives the height (in inches) of a sunflower plant as a function of time (days after it was planted). The height can be modeled by the logistic function: H = 100.8/1 + 23e^-0.093t where H is the height (in.) and t is the time (days). Make a plot of the height versus time. The figure should show the data from the table above as points and the height modeled by the equation as a solid line. Add a legend and label the axes
Step by Step Solution
There are 3 Steps involved in it
1 Expert Approved Answer
Step: 1 Unlock

Question Has Been Solved by an Expert!
Get step-by-step solutions from verified subject matter experts
Step: 2 Unlock
Step: 3 Unlock