

Question: This must be solved using MATLAB. 2. The following data gives the height (in inches) of a sunflower plant as a function of time (days
This must be solved using MATLAB.
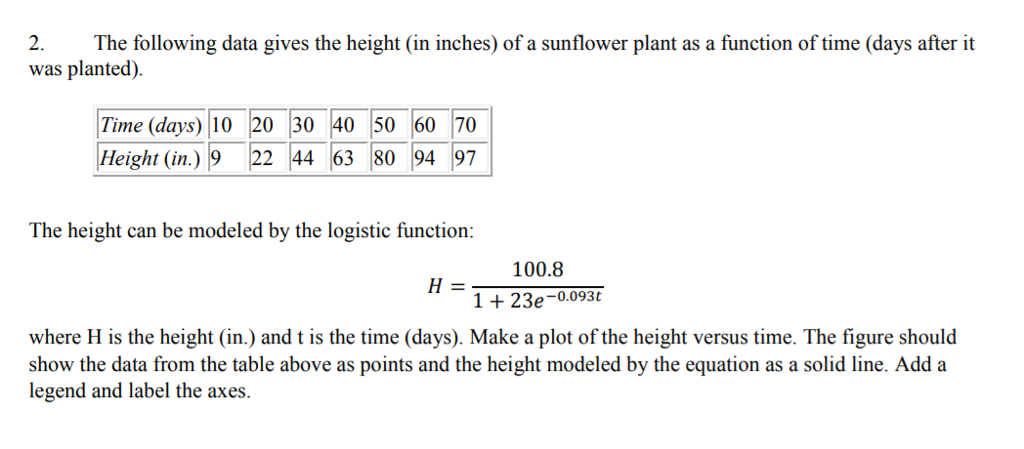
2. The following data gives the height (in inches) of a sunflower plant as a function of time (days after it was planted). Time (days) 1o 20 30 40 50 60 70 Height (in.) 9 22 44 63 80 94 97 The height can be modeled by the logistic function: 100.8 +23e-0.093t where H is the height (in.) and t is the time (days). Make a plot of the height versus time. The figure should show the data from the table above as points and the height modeled by the equation as a solid line. Add a legend and label the axes
Step by Step Solution
There are 3 Steps involved in it
1 Expert Approved Answer
Step: 1 Unlock

Question Has Been Solved by an Expert!
Get step-by-step solutions from verified subject matter experts
Step: 2 Unlock
Step: 3 Unlock