

Question: PPlease use formulas instead of excel to solve this question 10. The following table shows the returns achieved in different states of economy for stocks
 PPlease use formulas instead of excel to solve this question
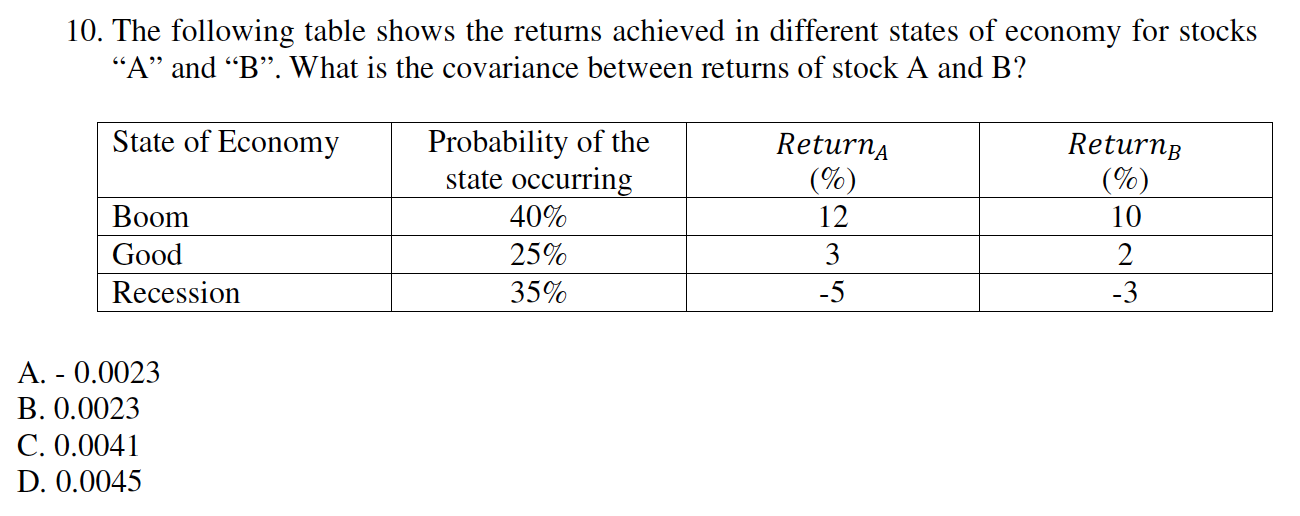
10. The following table shows the returns achieved in different states of economy for stocks A and B. What is the covariance between returns of stock A and B? State of Economy Boom Good Recession Probability of the state occurring 40% 25% 35% Returna (%) 12 3 -5 Returns (%) 10 2 -3 A. - 0.0023 B. 0.0023 C. 0.0041 D. 0.0045
Step by Step Solution
There are 3 Steps involved in it
1 Expert Approved Answer
Step: 1 Unlock

Question Has Been Solved by an Expert!
Get step-by-step solutions from verified subject matter experts
Step: 2 Unlock
Step: 3 Unlock