

Question: PR 21-6B margin of safety, and operating leverage Contribution margin, break -even sales , cost-volume-profit chart, OBJ. 2, 3, 4, 5 expects to maintain the
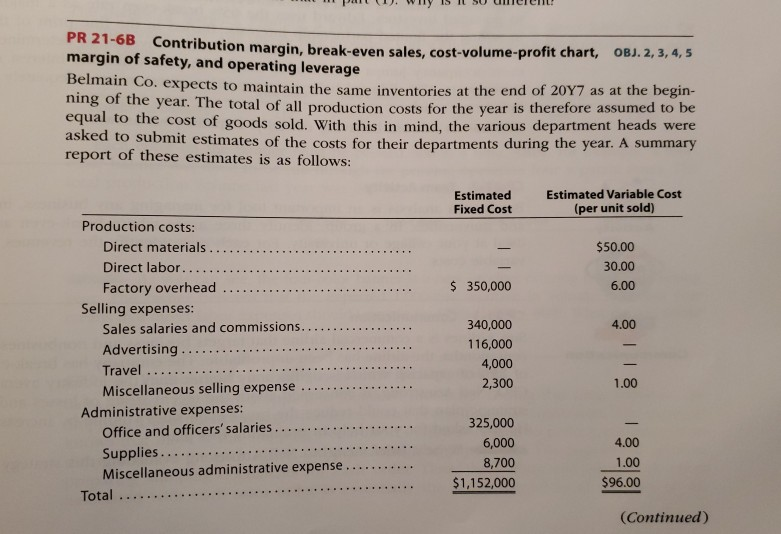
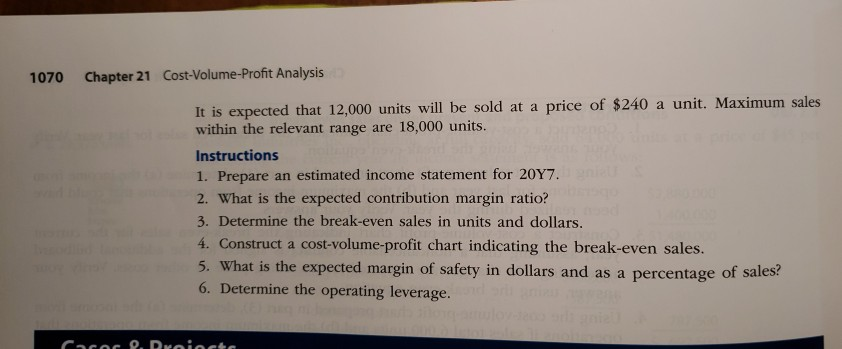
PR 21-6B margin of safety, and operating leverage Contribution margin, break -even sales , cost-volume-profit chart, OBJ. 2, 3, 4, 5 expects to maintain the same inventories at the end of 20Y7 as at the begin- ning of the year. The total of all production costs for the year is therefore assumed to be equal to the cost of goods sold. With this in mind, the various department heads were to submit estimates of the costs for their departments during the year. A summary report of these estimates is as follows: Estimated Fixed Cost Estimated Variable Cost (per unit sold) Production costs: Direct materials $50.00 30.00 $ 350,000 6.00 Selling expenses: 340,000 116,000 4,000 2,300 4.00 Miscellaneous selling expense . Administrative expenses: 1.00 325,000 6,000 8,700 $1,152,000 4.00 1.00 $96.00 Miscellaneous administrative expense (Continued) 1070 Chapter 21 Cost-Volume-Profit Analysis It is expected that 12,000 units will be sold at a price of $240 a unit. Maximum sales within the relevant range are 18,000 units. Instructions 1. Prepare an estimated income statement for 20Y7 2. What is the expected contribution margin ratio? 3. Determine the break-even sales in units and dollars. 4. Construct a cost-volume-profit chart indicating the break-even sales 5. What is the expected margin of safety in dollars and as a percentage of sales? 6. Determine the operating leverage
Step by Step Solution
There are 3 Steps involved in it

Get step-by-step solutions from verified subject matter experts