

Question: PRACTICAL RESEARCH 2 SUMMATIVE ASSESSMENT 7 DIRECTIONS: Read and analyze the situations below. Calculate the following analytically. Show your solution on the clean sheet of
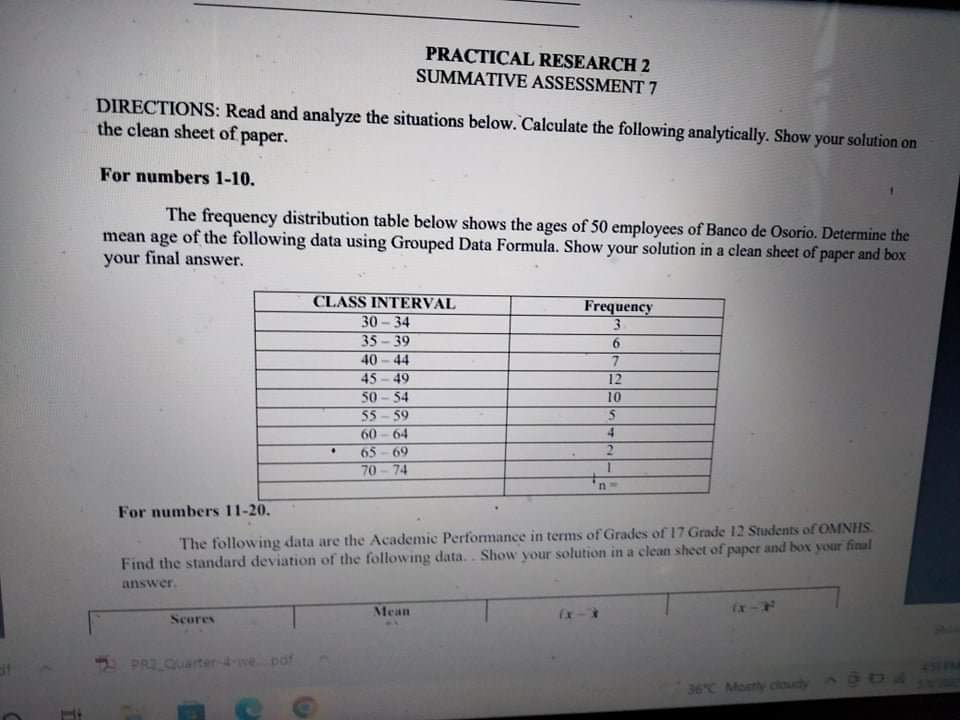
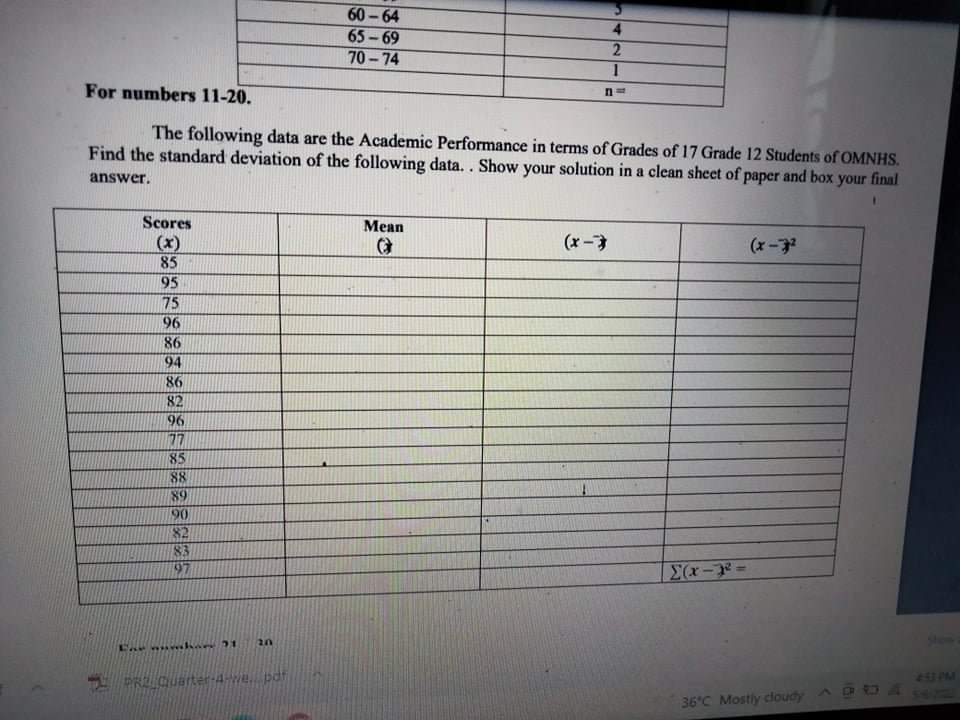
PRACTICAL RESEARCH 2 SUMMATIVE ASSESSMENT 7 DIRECTIONS: Read and analyze the situations below. Calculate the following analytically. Show your solution on the clean sheet of paper. For numbers 1-10. The frequency distribution table below shows the ages of 50 employees of Banco de Osorio. Determine the your final answer. mean age of the following data using Grouped Data Formula. Show your solution in a clean sheet of paper and box CLASS INTERVAL Frequency 30 - 34 3 35 - 39 40 -44 45 - 49 12 50 - 54 10 $5 - 59 60 64 65 -69 70 - 74 For numbers 11-20. The following data are the Academic Performance in terms of Grades of 17 Grade 12 Students of OMNHS. Find the standard deviation of the following data. . Show your solution in a clean sheet of paper and box your final answer. Scores Mean 2 PRI Quarter live pot 36% Mostly cloudy ~ 9 0 460 - 64 N AU 65 -69 70 - 74 For numbers 11-20. n= The following data are the Academic Performance in terms of Grades of 17 Grade 12 Students of OMNHS. Find the standard deviation of the following data. . Show your solution in a clean sheet of paper and box your final answer. Scores Mean (x) (x-3 (x - 32 85 95 75 96 86 94 86 82 96 785 88 89 90 83 197 Ex-R= 36'C Mostly cloudy DO4
Step by Step Solution
There are 3 Steps involved in it

Get step-by-step solutions from verified subject matter experts