

Question: PRACTICE GRAPHS (1) X 1.0 2.0 y -60.5 -1 0.5 3.0 40.6 4.0 90.8 5.0 140.8 6.0 190.8 7.0 241.0 8.0 29 1.0 9.0
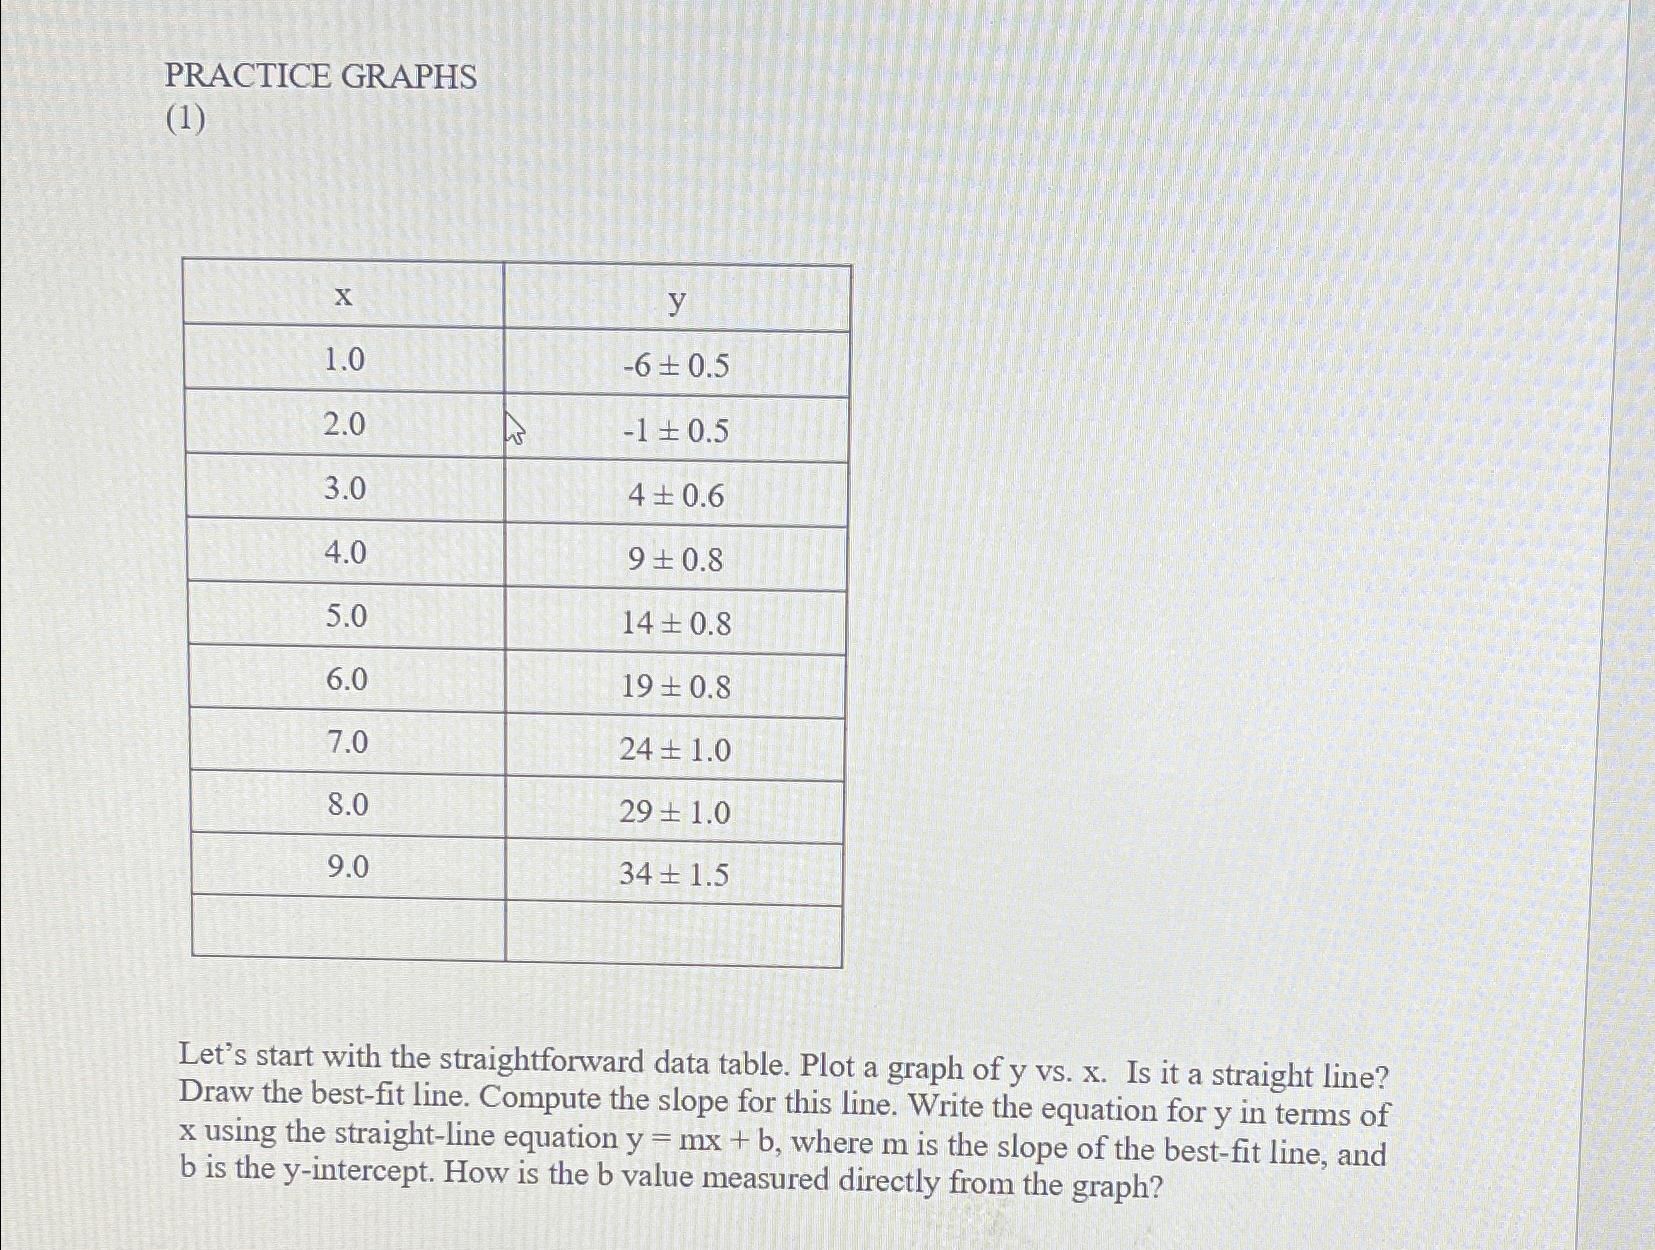
PRACTICE GRAPHS (1) X 1.0 2.0 y -60.5 -1 0.5 3.0 40.6 4.0 90.8 5.0 140.8 6.0 190.8 7.0 241.0 8.0 29 1.0 9.0 341.5 Let's start with the straightforward data table. Plot a graph of y vs. x. Is it a straight line? Draw the best-fit line. Compute the slope for this line. Write the equation for y in terms of x using the straight-line equation y = mx + b, where m is the slope of the best-fit line, and b is the y-intercept. How is the b value measured directly from the graph?
Step by Step Solution
3.42 Rating (168 Votes )
There are 3 Steps involved in it
To plot the graph of y vs x using the provided data we can use a scatter plot and then draw the best... View full answer

Get step-by-step solutions from verified subject matter experts