

Question: PRACTICE: MAKE SSPS USING DATA BELOW In EXCEL: Make a Figure (bar graph or scatterplot) of your means In SPSS: Run analysis to compare groups
PRACTICE: MAKE SSPS USING DATA BELOW
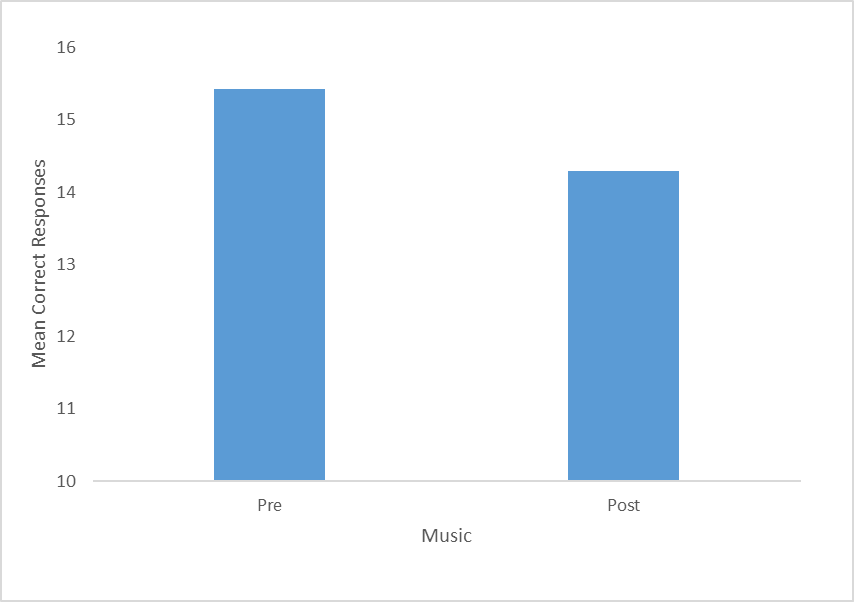
- In EXCEL: Make a Figure (bar graph or scatterplot) of your means
- In SPSS: Run analysis to compare groups (using a correlation or t-test) with means and standard deviations in output in SPSS
- Include and upload of your SPSS output.
- Write results section PARAGRAPH
- The type of analysis you ran (t-test, Pearson correlation)
- Your alpha level
- A description of the outcome in "plain English"
- The means and standard deviation
- Your significance test in the correct format
- A scatterplot or bar graph of the results
Turn in the Results section and SPSS output
DATA:
| IV | DV | IV - 1 = Coffee | 2= No Coffee | ||||||
| 1 | 31 | DV = Stroop Test | |||||||
| 1 | 55 | ||||||||
| 1 | 40 | ||||||||
| 1 | 22 | ||||||||
| 1 | 52 | ||||||||
| 1 | 48 | ||||||||
| 1 | 23 | ||||||||
| 1 | 25 | ||||||||
| 1 | 47 | ||||||||
| 1 | 50 | ||||||||
| 1 | 26 | ||||||||
| 1 | 43 | ||||||||
| 1 | 33 | ||||||||
| 1 | 49 | ||||||||
| 1 | 51 | ||||||||
| 1 | 21 | ||||||||
| 1 | 36 | ||||||||
| 1 | 44 | ||||||||
| 1 | 29 | ||||||||
| 1 | 54 | ||||||||
| 1 | 45 | ||||||||
| 1 | 38 | ||||||||
| 1 | 30 | ||||||||
| 1 | 41 | ||||||||
| 1 | 58 | ||||||||
| 1 | 27 | ||||||||
| 1 | 32 | ||||||||
| 1 | 56 | ||||||||
| 1 | 42 | ||||||||
| 1 | 34 | ||||||||
| 2 | 24 | ||||||||
| 2 | 28 | ||||||||
| 2 | 57 | ||||||||
| 2 | 59 | ||||||||
| 2 | 35 | ||||||||
| 2 | 53 | ||||||||
| 2 | 39 | ||||||||
| 2 | 60 | ||||||||
| 2 | 46 | ||||||||
| 2 | 37 | ||||||||
| 2 | 46 | ||||||||
| 2 | 26 | ||||||||
| 2 | 49 | ||||||||
| 2 | 38 | ||||||||
| 2 | 27 | ||||||||
| 2 | 52 | ||||||||
| 2 | 22 | ||||||||
| 2 | 50 | ||||||||
| 2 | 34 | ||||||||
| 2 | 40 | ||||||||
| 2 | 55 | ||||||||
| 2 | 35 | ||||||||
| 2 | 23 | ||||||||
| 2 | 45 | ||||||||
| 2 | 53 | ||||||||
| 2 | 21 | ||||||||
| 2 | 44 | ||||||||
| 2 | 31 | ||||||||
| 2 | 56 | ||||||||
| 2 | 59 | ||||||||
example:
\f
Step by Step Solution
There are 3 Steps involved in it
1 Expert Approved Answer
Step: 1 Unlock

Question Has Been Solved by an Expert!
Get step-by-step solutions from verified subject matter experts
Step: 2 Unlock
Step: 3 Unlock