

Question: Practice Problem for Linear Regression SUMMARY OUTPUT Regression Statistics Multiple R R Square Adjusted R Square Standard Error Observations 0.470 0.221 0.207 0.064 60 ANOVA
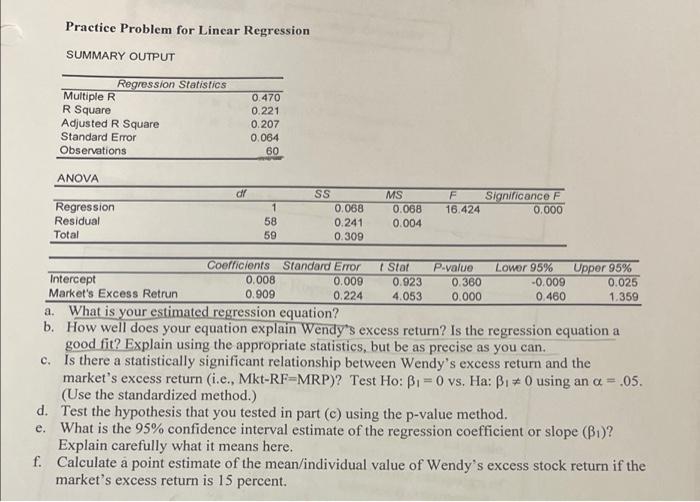
Practice Problem for Linear Regression SUMMARY OUTPUT Regression Statistics Multiple R R Square Adjusted R Square Standard Error Observations 0.470 0.221 0.207 0.064 60 ANOVA dr Regression Residual Total SS 0.068 0.241 0.309 F Significance F 16.424 0.000 1 58 59 MS 0.068 0.004 a. Coefficients Standard Error I Stof P.value Lower 95% Upper 95% Intercept 0.008 0.009 0.923 0.360 -0.009 0.025 Market's Excess Retrun 0.909 0.224 4.053 0.000 0.460 1.359 What is your estimated regression equation? b. How well does your equation explain Wendy's excess return? Is the regression equation a good fit? Explain using the appropriate statistics, but be as precise as you can. c. Is there a statistically significant relationship between Wendy's excess return and the market's excess return (i.e., Mkt-RF-MRP)? Test Ho: B1 = 0 vs. Ha: B0 using an a = .05. (Use the standardized method.) d. Test the hypothesis that you tested in part (c) using the p-value method. e. What is the 95% confidence interval estimate of the regression coefficient or slope (B1)? Explain carefully what it means here. f. Calculate a point estimate of the mean/individual value of Wendy's excess stock return if the market's excess return is 15 percent. Practice Problem for Linear Regression SUMMARY OUTPUT Regression Statistics Multiple R R Square Adjusted R Square Standard Error Observations 0.470 0.221 0.207 0.064 60 ANOVA dr Regression Residual Total SS 0.068 0.241 0.309 F Significance F 16.424 0.000 1 58 59 MS 0.068 0.004 a. Coefficients Standard Error I Stof P.value Lower 95% Upper 95% Intercept 0.008 0.009 0.923 0.360 -0.009 0.025 Market's Excess Retrun 0.909 0.224 4.053 0.000 0.460 1.359 What is your estimated regression equation? b. How well does your equation explain Wendy's excess return? Is the regression equation a good fit? Explain using the appropriate statistics, but be as precise as you can. c. Is there a statistically significant relationship between Wendy's excess return and the market's excess return (i.e., Mkt-RF-MRP)? Test Ho: B1 = 0 vs. Ha: B0 using an a = .05. (Use the standardized method.) d. Test the hypothesis that you tested in part (c) using the p-value method. e. What is the 95% confidence interval estimate of the regression coefficient or slope (B1)? Explain carefully what it means here. f. Calculate a point estimate of the mean/individual value of Wendy's excess stock return if the market's excess return is 15 percent
Step by Step Solution
There are 3 Steps involved in it

Get step-by-step solutions from verified subject matter experts