

Question: Predictions are: M5: === Cross-validation === === Summary === Correlation coefficient 0.7935 Mean absolute error 1.7017 Root mean squared error 2.8612 Relative absolute error 58.8734
 Predictions are:
M5: === Cross-validation === === Summary ===
Correlation coefficient 0.7935 Mean absolute error 1.7017 Root mean squared error 2.8612 Relative absolute error 58.8734 % Root relative squared error 61.3972 % Total Number of Instances 188 === Evaluation on test set === === Summary ===
Correlation coefficient 0.8676 Mean absolute error 1.4602 Root mean squared error 2.3051 Relative absolute error 50.8243 % Root relative squared error 49.7297 % Total Number of Instances 188 Greedy:
=== Cross-validation === === Summary ===
Correlation coefficient 0.7961 Mean absolute error 1.6939 Root mean squared error 2.8425 Relative absolute error 58.6027 % Root relative squared error 60.9977 % Total Number of Instances 188 === Evaluation on test set === === Summary ===
Correlation coefficient 0.8673 Mean absolute error 1.4644 Root mean squared error 2.3073 Relative absolute error 50.9693 % Root relative squared error 49.778 % Total Number of Instances 188
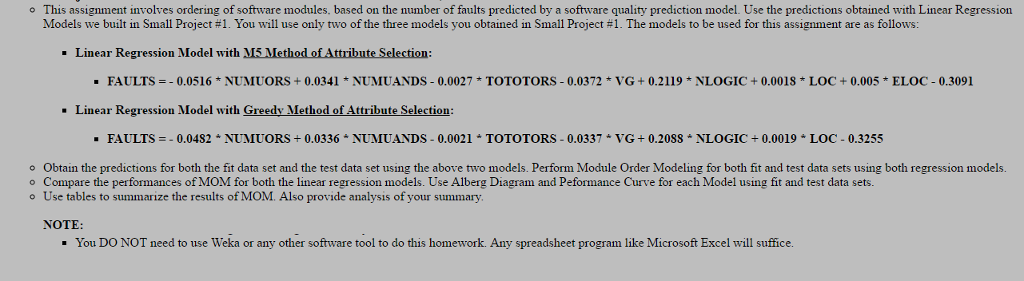
o This assignment involves ordering of software modules. based on the number of faults predicted by a software quality prediction model. Use the predictions obtained with Linear Regression Models we built in Small Project #1. You will use only two of the three models you obtained in Small Project #1. The models to be used for this assignment are as follows: Linear Regression Model with M5Method ofAttribute Selection: FAULTS 0.0516 NUMUORS 0.0341 NUMUANDOS 0.0027 TOTOTORS 0.0372 VG 0.2119 NLOGIC 0.001S LOC 0.005 ELOC 0.3091 Linear Regression Model with Greedy Method of Attribute Selection FAULTS 0.0482 a NUMUORS 0.0336 NUMUTANDS 0,0021 TOTOTORS 0.0337 VG 0.20SS NLOGIC 0.0019 LOC 0.3255 o obtain the predictions for both the fit data set and the test data set using the above two models. Perform Module Order Modeling for both fit and test data sets using both regression models. o Compare the performances of MOM for both the linear regression models. Use Alberg Diagram and Peformance Curve for each Model using fit and test data sets. o Use tables to summarize the results of MOM. Also provide analysis of your summary. NOTE: You DO NOT need to use Weka or any other software tool to do this homework. Any spreadsheet program like Microsoft Excel will suffice. o This assignment involves ordering of software modules. based on the number of faults predicted by a software quality prediction model. Use the predictions obtained with Linear Regression Models we built in Small Project #1. You will use only two of the three models you obtained in Small Project #1. The models to be used for this assignment are as follows: Linear Regression Model with M5Method ofAttribute Selection: FAULTS 0.0516 NUMUORS 0.0341 NUMUANDOS 0.0027 TOTOTORS 0.0372 VG 0.2119 NLOGIC 0.001S LOC 0.005 ELOC 0.3091 Linear Regression Model with Greedy Method of Attribute Selection FAULTS 0.0482 a NUMUORS 0.0336 NUMUTANDS 0,0021 TOTOTORS 0.0337 VG 0.20SS NLOGIC 0.0019 LOC 0.3255 o obtain the predictions for both the fit data set and the test data set using the above two models. Perform Module Order Modeling for both fit and test data sets using both regression models. o Compare the performances of MOM for both the linear regression models. Use Alberg Diagram and Peformance Curve for each Model using fit and test data sets. o Use tables to summarize the results of MOM. Also provide analysis of your summary. NOTE: You DO NOT need to use Weka or any other software tool to do this homework. Any spreadsheet program like Microsoft Excel will suffice
Step by Step Solution
There are 3 Steps involved in it

Get step-by-step solutions from verified subject matter experts