

Question: The models to be used for this assignment are as follows: Linear Regression Model with M5 Method of Attribute Selection: FAULTS = - 0.0516 *
The models to be used for this assignment are as follows:
Linear Regression Model with M5 Method of Attribute Selection:
FAULTS = - 0.0516 * NUMUORS + 0.0341 * NUMUANDS - 0.0027 * TOTOTORS - 0.0372 * VG + 0.2119 * NLOGIC + 0.0018 * LOC + 0.005 * ELOC - 0.3091
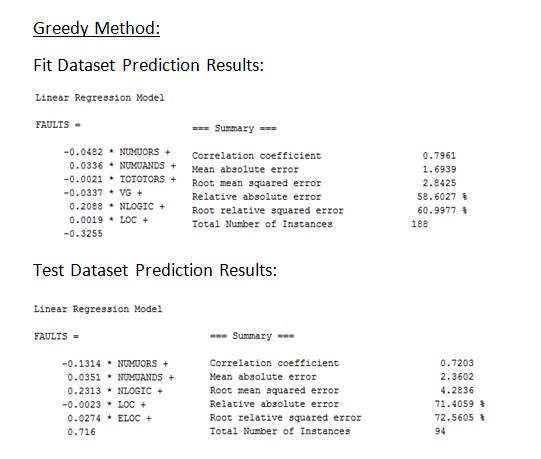
Linear Regression Model with Greedy Method of Attribute Selection:
FAULTS = - 0.0482 * NUMUORS + 0.0336 * NUMUANDS - 0.0021 * TOTOTORS - 0.0337 * VG + 0.2088 * NLOGIC + 0.0019 * LOC - 0.3255
Obtain the predictions for both the fit data set and the test data set using the above two models. Perform Module Order Modeling for both fit and test data sets using both regression models. Compare the performances of MOM for both the linear regression models. Use Alberg Diagram and Peformance Curve for each Model using fit and test data sets. Use tables to summarize the results of MOM. Also provide analysis of your summary.
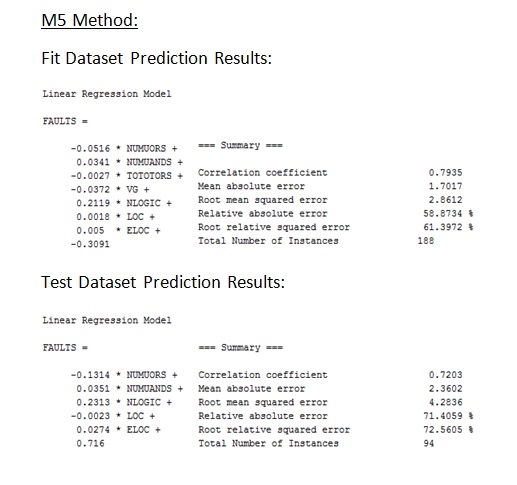
M5 Method: Fit Dataset Prediction Results: Linear Regression Model FAULTS = Summary === === -0.0516 * NUMVORS + 0.0341 NUMUANDS -0.0027 TOTOTORS+Correlation c -0.0372VG 0.7935 1.7017 2.8612 58.8734 61.3972 % Hean absolute error 0.2119 NLOGICRoot mean 0.0018 LOC + 0.005 ELOC+ Relative absolute ezror Root relative squared error Total Number of Instances -0.3091 188 Test Dataset Prediction Results: Linear Regression Model FAULTS Summary 0.1314 NUMUORSCorelation coefficient 0.0351 NUMUANDSMean absolute error 0.2313NLOGIC+ Root mean squared error Relative absolute error Root relative aquared error Total Number of Instances 0.7203 2.3602 4.2836 71.4059 72.5605 -0.0023 LOC + 0.0274 ELOC+ 0-716 94 M5 Method: Fit Dataset Prediction Results: Linear Regression Model FAULTS = Summary === === -0.0516 * NUMVORS + 0.0341 NUMUANDS -0.0027 TOTOTORS+Correlation c -0.0372VG 0.7935 1.7017 2.8612 58.8734 61.3972 % Hean absolute error 0.2119 NLOGICRoot mean 0.0018 LOC + 0.005 ELOC+ Relative absolute ezror Root relative squared error Total Number of Instances -0.3091 188 Test Dataset Prediction Results: Linear Regression Model FAULTS Summary 0.1314 NUMUORSCorelation coefficient 0.0351 NUMUANDSMean absolute error 0.2313NLOGIC+ Root mean squared error Relative absolute error Root relative aquared error Total Number of Instances 0.7203 2.3602 4.2836 71.4059 72.5605 -0.0023 LOC + 0.0274 ELOC+ 0-716 94
Step by Step Solution
There are 3 Steps involved in it

Get step-by-step solutions from verified subject matter experts