

Question: Predictions from the Multiple Regression Models Given that the population regression model Vi = Bo + B1X1i + B2X1i + ... + BkXKi + holds
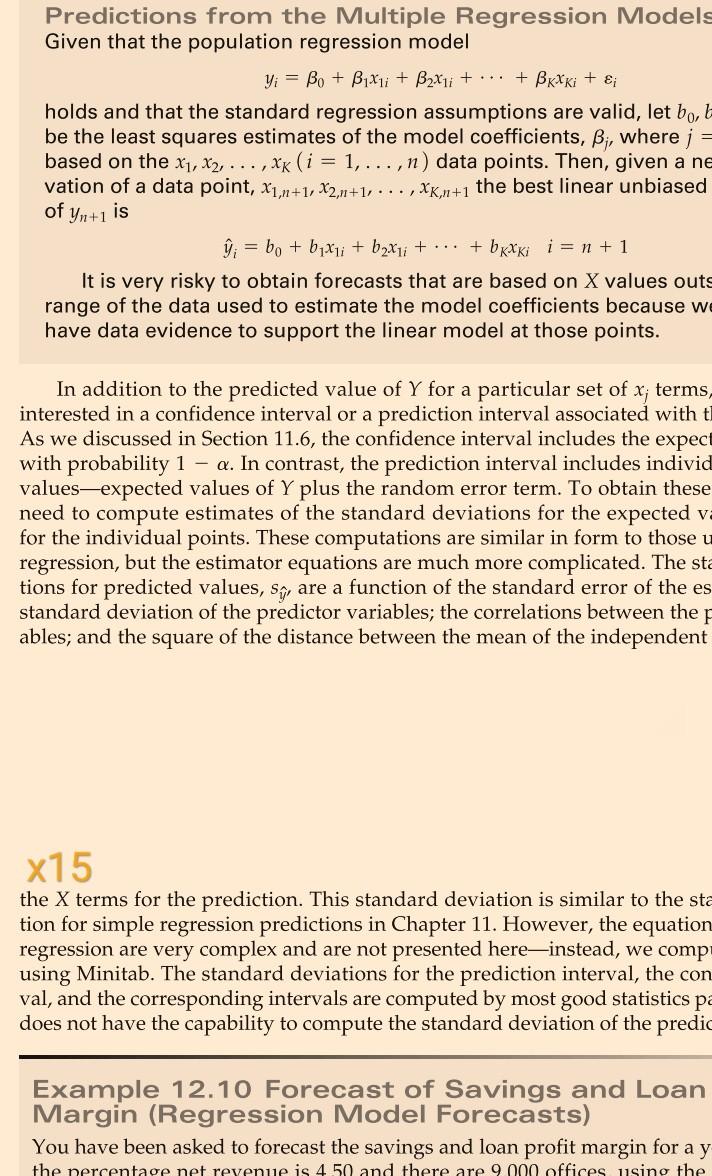
Predictions from the Multiple Regression Models Given that the population regression model Vi = Bo + B1X1i + B2X1i + ... + BkXKi + holds and that the standard regression assumptions are valid, let bo, b be the least squares estimates of the model coefficients, B;, where j = based on the x1,x2,..., xk (i = 1,...,n) data points. Then, given a ne vation of a data point, X1,1+1, X2,11+1, ..., XK,n+1 the best linear unbiased of Yn+1 is ; = bo + byxli + b2xui + ... + bkxki i = n +1 It is very risky to obtain forecasts that are based on X values outs range of the data used to estimate the model coefficients because w have data evidence to support the linear model at those points. In addition to the predicted value of Y for a particular set of x; terms interested in a confidence interval or a prediction interval associated with ti As we discussed in Section 11.6, the confidence interval includes the expect with probability 1 - a. In contrast, the prediction interval individ values-expected values of Y plus the random error term. To obtain these need to compute estimates of the standard deviations for the expected v for the individual points. These computations are similar in form to those u regression, but the estimator equations are much more complicated. The sta tions for predicted values, Sq, are a function of the standard error of the es standard deviation of the predictor variables; the correlations between the p ables; and the square of the distance between the mean of the independent x15 the X terms for the prediction. This standard deviation is similar to the sta tion for simple regression predictions in Chapter 11. However, the equation regression are very complex and are not presented hereinstead, we comp using Minitab. The standard deviations for the prediction interval, the con val, and the corresponding intervals are computed by most good statistics pa does not have the capability to compute the standard deviation of the predic Example 12.10 Forecast of Savings and Loan Margin (Regression Model Forecasts) You have been asked to forecast the savings and loan profit margin for a y the percentage net revenue is 450 and there are 9 000 offices using the
Step by Step Solution
There are 3 Steps involved in it
1 Expert Approved Answer
Step: 1 Unlock

Question Has Been Solved by an Expert!
Get step-by-step solutions from verified subject matter experts
Step: 2 Unlock
Step: 3 Unlock