

Question: Preferably in Excel or just write formula down LCL=70.36), and those for the R chart are (UCL=23.53,LCL=0) 1. Compute the revised upper control limit (UCL)
 Preferably in Excel or just write formula down
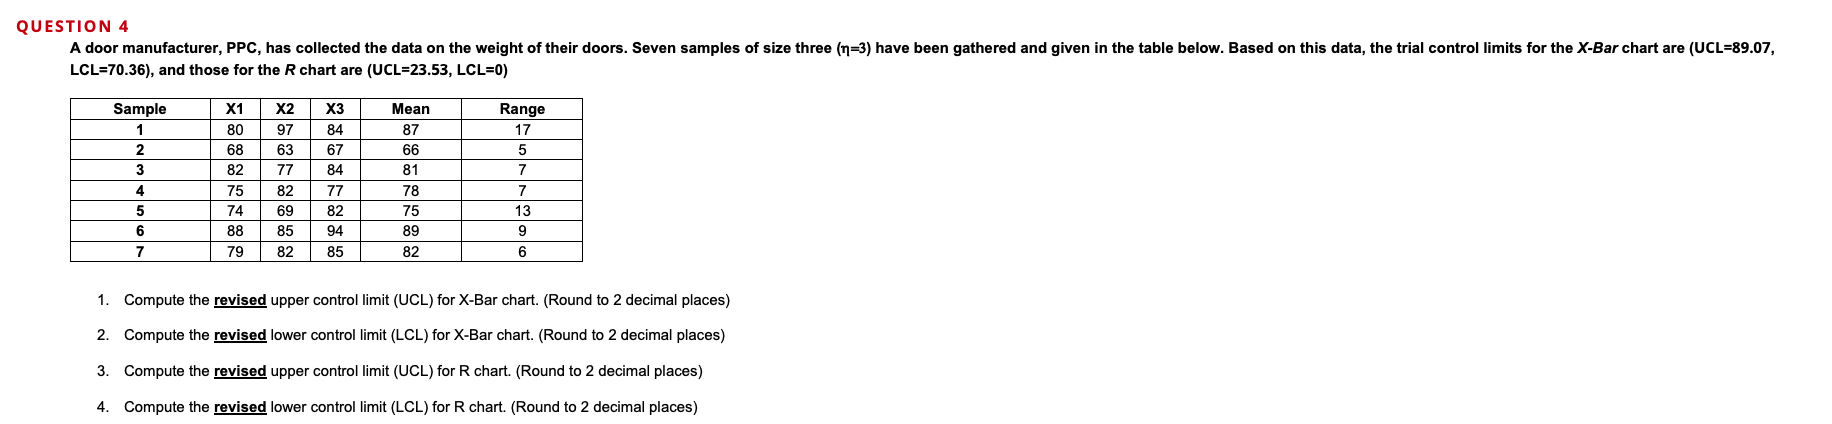
LCL=70.36), and those for the R chart are (UCL=23.53,LCL=0) 1. Compute the revised upper control limit (UCL) for X-Bar chart. (Round to 2 decimal places) 2. Compute the revised lower control limit (LCL) for X-Bar chart. (Round to 2 decimal places) 3. Compute the revised upper control limit (UCL) for R chart. (Round to 2 decimal places) 4. Compute the revised lower control limit (LCL) for R chart. (Round to 2 decimal places)
Step by Step Solution
There are 3 Steps involved in it
1 Expert Approved Answer
Step: 1 Unlock

Question Has Been Solved by an Expert!
Get step-by-step solutions from verified subject matter experts
Step: 2 Unlock
Step: 3 Unlock