

Table 12 lists fall undergraduate enrollment by gender in U.S. degree-granting institutions. The figure contains a scatter
Question:
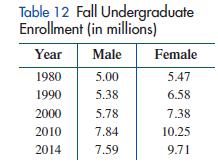
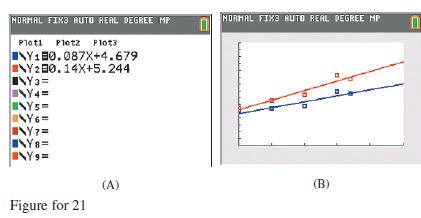
Table 12 lists fall undergraduate enrollment by gender in U.S. degree-granting institutions. The figure contains a scatter plot and regression line for each data set, where x represents years since 1980 and y represents enrollment (in millions).
(A) Interpret the slope of each model.
(B) Use the regression models to predict the male and female undergraduate enrollments in 2025.
(C) Use the regression models to estimate the first year in which female undergraduate enrollment will exceed male undergraduate enrollment by at least 3 million.
Step by Step Answer:

This question has not been answered yet.
You can Ask your question!
Related Book For 

College Mathematics For Business Economics, Life Sciences, And Social Sciences
ISBN: 978-0134674148
14th Edition
Authors: Raymond Barnett, Michael Ziegler, Karl Byleen, Christopher Stocker
Question Posted:
