

Question: >>> Preferably in Matlab , if not Python works too Part-II: hybrid image generation in frequency domain In this problem, you will implement your own
>>> Preferably in Matlab, if not Python works too
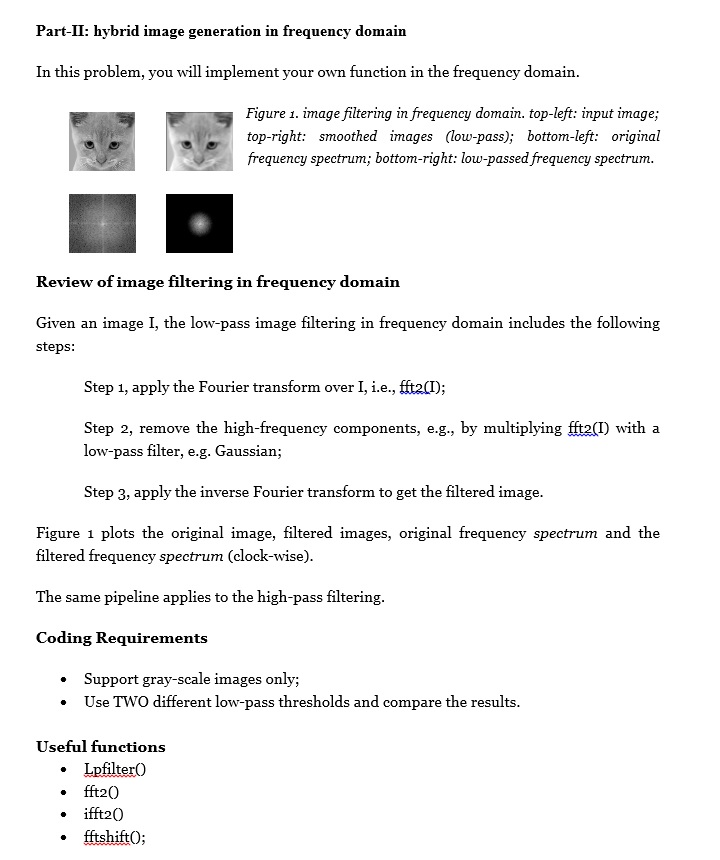
Part-II: hybrid image generation in frequency domain In this problem, you will implement your own function in the frequency domain. Figure 1. image filtering in frequency domain. top-left: input image,; top-right: smoothed images (low-pass); bottom-left: originail frequency spectrum; bottom-right: low-passed frequency spectrum. Review ofimage filtering in frequency domain Given an image I, the low-pass image filtering in frequency domain includes the following steps Step 1, apply the Fourier transform over I, i.e., fft2(D; Step 2, remove the high-frequency components, e.g., by multiplying fft2(I) with a low-pass filter, e.g. Gaussian; Step 3, apply the inverse Fourier transform to get the filtered image Figure 1 plots the original image, filtered images, original frequency spectrum and the filtered frequency spectrum (clock-wise) The same pipeline applies to the high-pass filtering Coding Requirements . Support gray-scale images only; Use TWO different low-pass thresholds and compare the results Useful function LpfilterO . ifft20 Part-II: hybrid image generation in frequency domain In this problem, you will implement your own function in the frequency domain. Figure 1. image filtering in frequency domain. top-left: input image,; top-right: smoothed images (low-pass); bottom-left: originail frequency spectrum; bottom-right: low-passed frequency spectrum. Review ofimage filtering in frequency domain Given an image I, the low-pass image filtering in frequency domain includes the following steps Step 1, apply the Fourier transform over I, i.e., fft2(D; Step 2, remove the high-frequency components, e.g., by multiplying fft2(I) with a low-pass filter, e.g. Gaussian; Step 3, apply the inverse Fourier transform to get the filtered image Figure 1 plots the original image, filtered images, original frequency spectrum and the filtered frequency spectrum (clock-wise) The same pipeline applies to the high-pass filtering Coding Requirements . Support gray-scale images only; Use TWO different low-pass thresholds and compare the results Useful function LpfilterO . ifft20
Step by Step Solution
There are 3 Steps involved in it

Get step-by-step solutions from verified subject matter experts