

Question: Prepare a graph of the monthly forecasts and average forecast demand for Chicago Paint Corp., a manufacturer of specialized paint for artists. Compute the
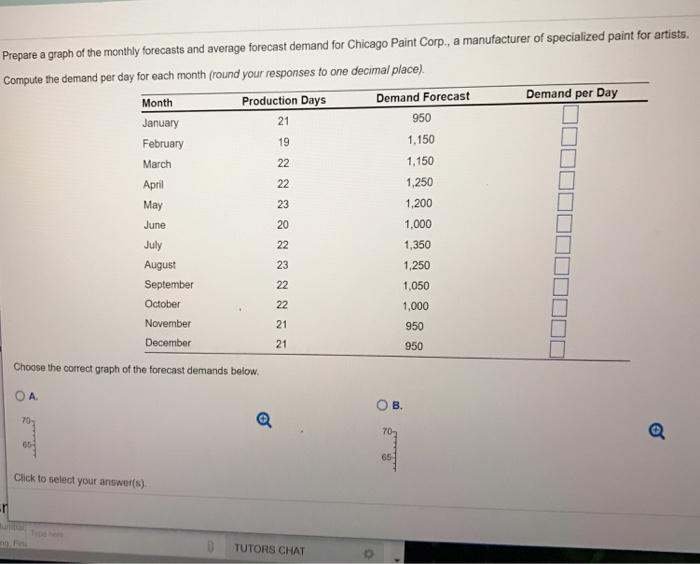
Prepare a graph of the monthly forecasts and average forecast demand for Chicago Paint Corp., a manufacturer of specialized paint for artists. Compute the demand per day for each month (round your responses to one decimal place). Production Days Demand Forecast n July August September October November December Choose the correct graph of the forecast demands below. OA 70- Month January February March April May June Click to select your answer(s). ing, Fin Q 22NNNNNNNNN 21 19 23 20 23 21 21 TUTORS CHAT 950 1,150 1,150 1,250 1,200 1,000 1,350 1,250 1,050 1,000 950 950 8. 70 Demand per Day
Step by Step Solution
3.44 Rating (154 Votes )
There are 3 Steps involved in it
Calculation of Demand per day and average monthly forecast Month Pro... View full answer

Get step-by-step solutions from verified subject matter experts