

Question: Prepare a table for J. crew Group company that reports the gross margin ration using the revenues and costs of goods sold data from income
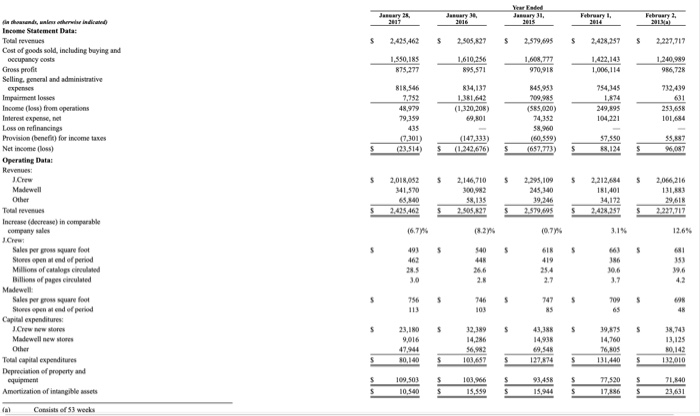
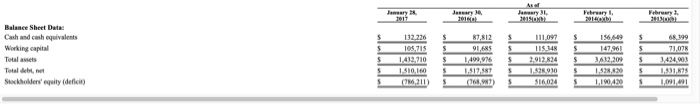
January 2016 January 11, 2015 February 1. 2014 February 2. 2) 2017 $ 2,435,462 $ 2.505.22 $ 2.579.495 $ 2,428,257 $ 2.227.717 1,550,185 875.277 1,610,256 895,571 1.608,777 970,918 1.422,143 1,006,114 1.240,989 986,728 818,546 7.752 48,979 79,359 814,137 1.381,642 (1.320,208) 69,801 845,953 709,985 (585,020) 74,352 38,90 (60,559) (657,773) 754,345 1,874 249,895 104,221 732,439 631 253,658 101,684 (7,301 (23,514) (147,333) (1.242,676) 57,550 88,124 35,87 5,087 $ $ $ $ $ $ 5 2,066,216 2,018,052 141,570 2,146,710 300,982 2,295,109 245,140 39,246 2.979.495 2.212.184 181,401 34,172 2.423,257 2.425,462 2.505,627 in thousands, unless the Indiana Income Statement Data: Total revenues Cost of goods sold, including buying and occupancy costs Gross profit Selling, gmeral and administrative espres Impairment losses Income (oss) from operations Interest expense, Loss on refinancing Provision (benefit) for income taxes Net income (los) Operating Data Revenues J.Crew Madewell Other Total revenues Increase (decrease in comparable company sales J.Crew Sales por gross square foot Stores open end of Millions of catalogs circulated Billions of paper circulated Madewell Sales per prow square foot Stores open ander pred Capital expenditures J.Chwores Madewell new stores Other Total capital expenditures Depreciation of property and equipment Amortization of intangible sets Consists of 3 weeks 2.227,717 (6.79% (0.77 3.19 s 540 44 5 462 285 3.0 618 419 254 2.7 186 10,6 3.7 353 W9.6 4.2 28 s 756 5 s 5 $ 746 103 747 85 709 65 48 s $ s s S 32,389 14,286 38,743 13,125 14,938 23,180 9,016 47,944 80,140 39,875 14,760 76,805 131440 $6.92 101,657 127,874 $ $ 132,010 $ S 5 $ 77.520 S 109.03 10,540 103,966 15,559 93,458 15,944 71,840 23.631 $ $ s $ Jary January 16, 1014 January 31, February February $ 156,649 5 $ 5 S Balance Sheet Data Cash and cash equivalents Working capital Totales Total de Stockholders' equity deficit) S 132.226 105.715 1432210 1510160 6,211 87,812 91.685 1.499,976 1,519.57 (107 $ 5 $ 111.097 115 348 2,912 824 1.828.010 516024 5 $ $ $ 6199 71,078 3.42403 1.531.625 1,091,091 3,612,209 1.58820 1.190.4.20 $ $ S
Step by Step Solution
There are 3 Steps involved in it

Get step-by-step solutions from verified subject matter experts