-Prepare a vertical common-size income statement and balance sheet. Note: Use Total Sales and Total Assets as the denominators for the income statement and balance sheet, respectively. Compute for 2020, 2019, and 2018.
-Prepare horizontal analysis on income statements and balance sheets for 2020 and 2019.
-Prepare ratio analyses (for 2020, 2019, and 2018).
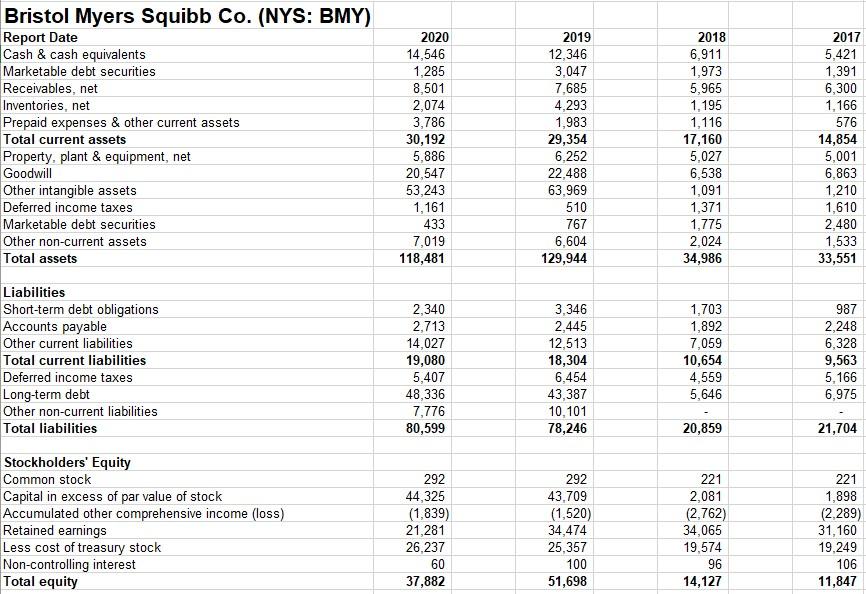
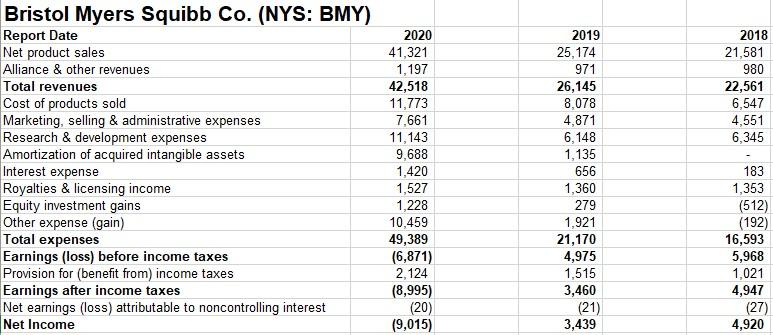
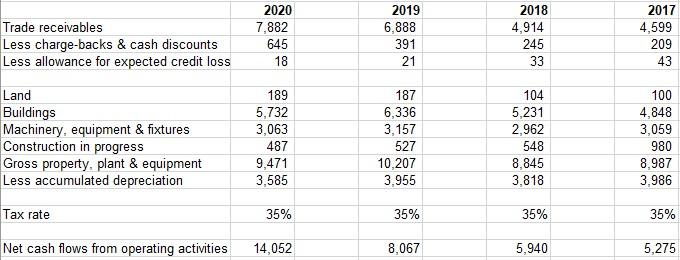
Bristol Myers Squibb Co. (NYS: BMY) Report Date Cash & cash equivalents Marketable debt securities Receivables, net Inventories, net Prepaid expenses & other current assets Total current assets Property, plant & equipment, net Goodwill Other intangible assets Deferred income taxes Marketable debt securities Other non-current assets Total assets Liabilities Short-term debt obligations Accounts payable Other current liabilities Total current liabilities Deferred income taxes Long-term debt Other non-current liabilities Total liabilities Stockholders' Equity Common stock Capital in excess of par value of stock Accumulated other comprehensive income (loss) Retained earnings Less cost of treasury stock Non-controlling interest Total equity 2020 14,546 1,285 8,501 2,074 3,786 30,192 5,886 20,547 53,243 1,161 433 7,019 118,481 2,340 2,713 14,027 19,080 5,407 48,336 7,776 80,599 292 44,325 (1,839) 21,281 26,237 60 37,882 2019 12,346 3,047 7,685 4,293 1,983 29,354 6,252 22,488 63,969 510 767 6,604 129,944 3,346 2,445 12,513 18,304 6,454 43,387 10,101 78,246 292 43,709 (1,520) 34,474 25,357 100 51,698 2018 6,911 1,973 5,965 1,195 1,116 17,160 5,027 6,538 1,091 1,371 1,775 2,024 34,986 1,703 1,892 7,059 10,654 4,559 5,646 20,859 221 2,081 (2,762) 34,065 19,574 96 14,127 2017 5,421 1,391 6,300 1,166 576 14,854 5,001 6,863 1,210 1,610 2,480 1,533 33,551 987 2,248 6,328 9,563 5,166 6,975 21,704 221 1,898 (2,289) 31,160 19,249 106 11,847 Bristol Myers Squibb Co. (NYS: BMY) Report Date Net product sales Alliance & other revenues Total revenues Cost of products sold Marketing, selling & administrative expenses Research & development expenses Amortization of acquired intangible assets Interest expense Royalties & licensing income Equity investment gains. Other expense (gain) Total expenses Earnings (loss) before income taxes Provision for (benefit from) income taxes Earnings after income taxes Net earnings (loss) attributable to noncontrolling interest Net Income 2020 41,321 1,197 42,518 11,773 7,661 11,143 9,688 1,420 1,527 1,228 10,459 49,389 (6,871) 2,124 (8,995) (20) (9,015) 2019 25,174 971 26,145 8,078 4,871 6,148 1,135 656 1,360 279 1,921 21,170 4,975 1,515 3,460 3,439 (21) 2018 21,581 980 22,561 6,547 4,551 6,345 183 1,353 (512) (192) 16,593 5,968 1,021 4,947 4,920 (27) 2020 7,882 645 Trade receivables Less charge-backs & cash discounts Less allowance for expected credit loss 18 Land 189 Buildings 5,732 3,063 Machinery, equipment & fixtures Construction in progress 487 Gross property, plant & equipment 9,471 Less accumulated depreciation 3,585 Tax rate 35% Net cash flows from operating activities 14,052 2019 6,888 391 21 187 6,336 3,157 527 10,207 3,955 35% 8,067 2018 4,914 245 33 104 5,231 2,962 548 8,845 3,818 35% 5,940 2017 4,599 209 43 100 4,848 3,059 980 8,987 3,986 35% 5,275


