

Question: Presented below are the 2018 income statement and comparative balance sheets for Santana Industries. Presented below are the 2018 income statement and comparative balance sheets
 Presented below are the 2018 income statement and comparative balance sheets for Santana Industries.
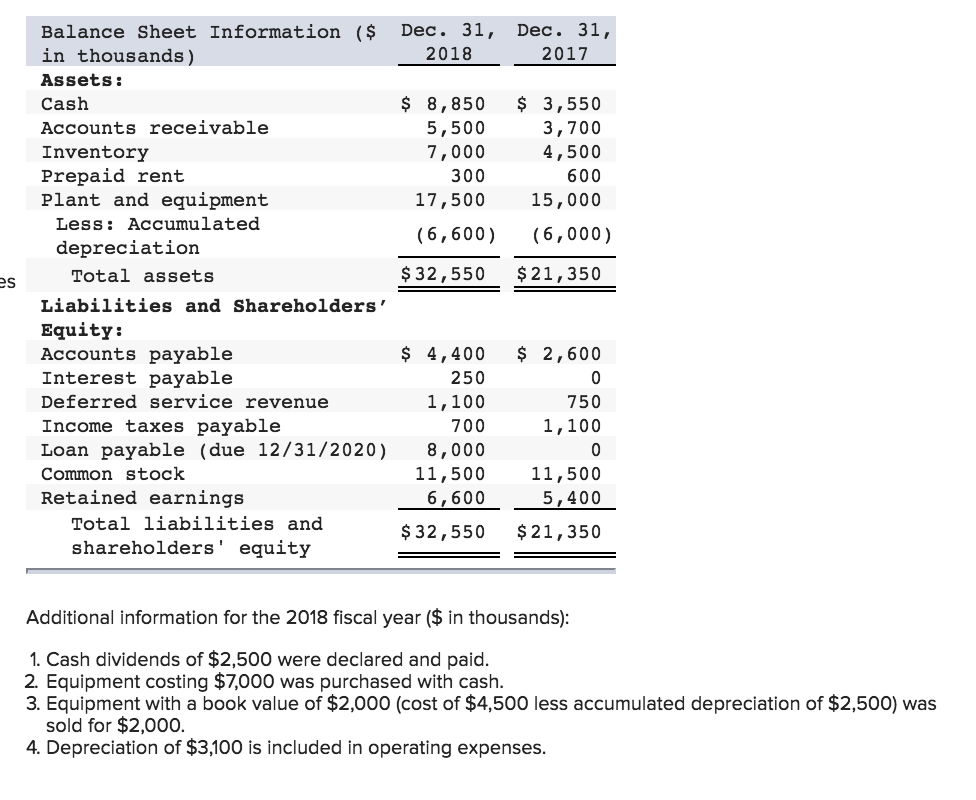
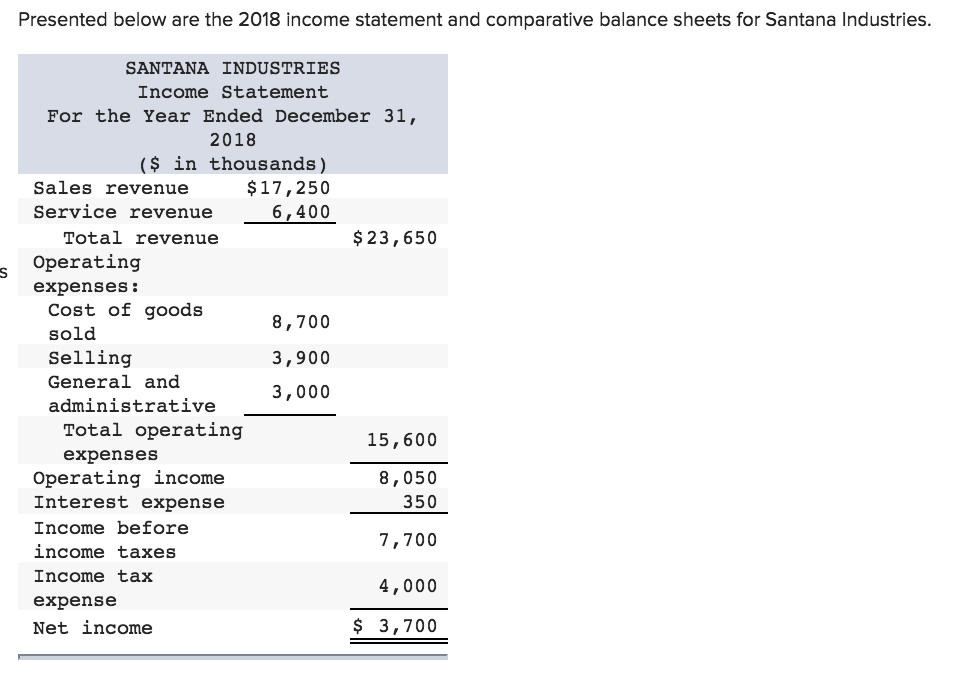
Presented below are the 2018 income statement and comparative balance sheets for Santana Industries SANTANA INDUSTRIES Income Statement For the Year Ended December 31, 2018 ($in thousands) Sales revenue Service revenue $17,250 6,400 Total revenue $23,650 Operating expenses: Cost of goods sold Selling General and administrative 8,700 3,900 3,000 Total operating expenses 15,600 Operating income Interest expense Income before income taxes Income tax expense Net income 8,050 350 7,700 4,000 $ 3,700
Step by Step Solution
There are 3 Steps involved in it
1 Expert Approved Answer
Step: 1 Unlock

Question Has Been Solved by an Expert!
Get step-by-step solutions from verified subject matter experts
Step: 2 Unlock
Step: 3 Unlock