

Question: Press Window Use the green rectangle (triangle symbols) to compute total revenue at various prices along the demand curve. Note: You will not be graded

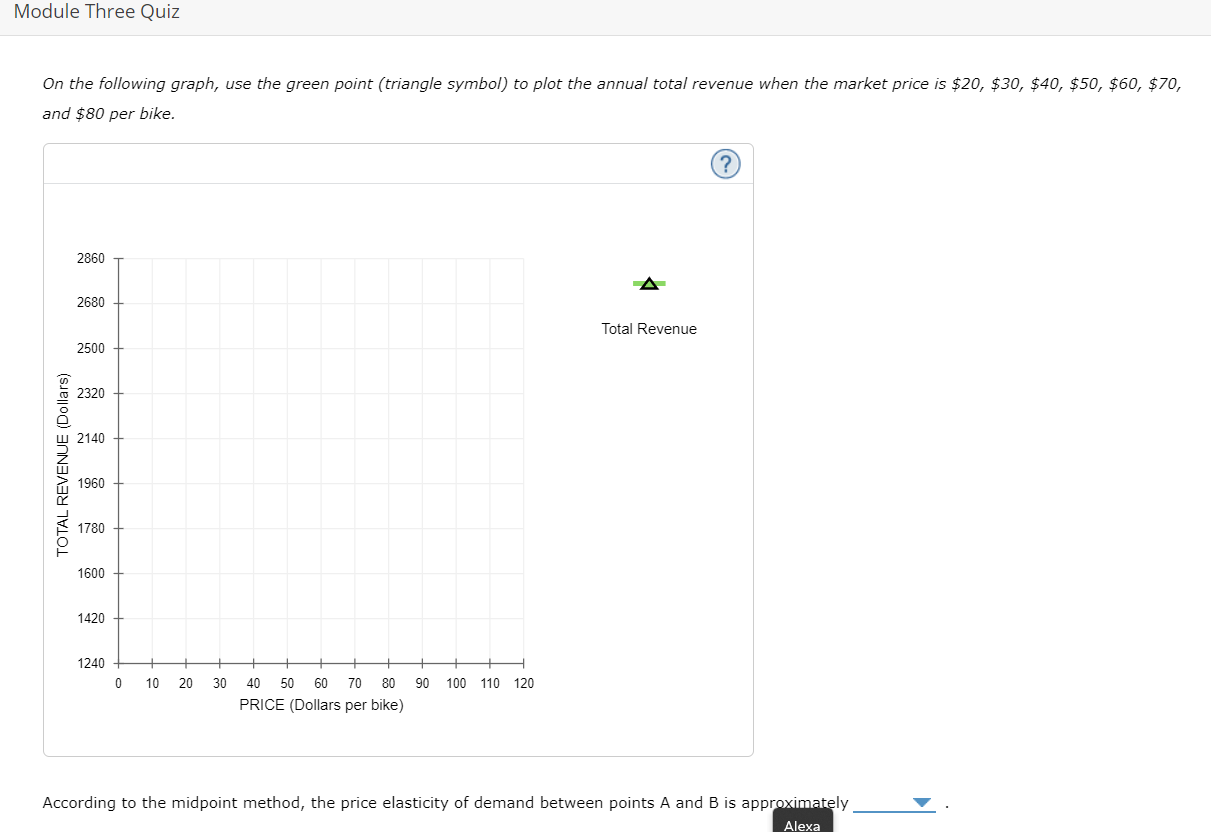
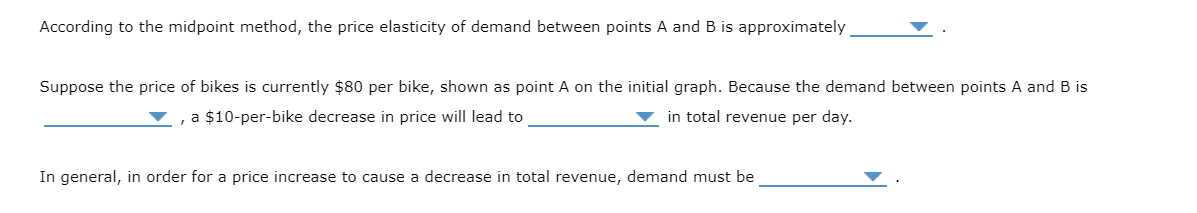
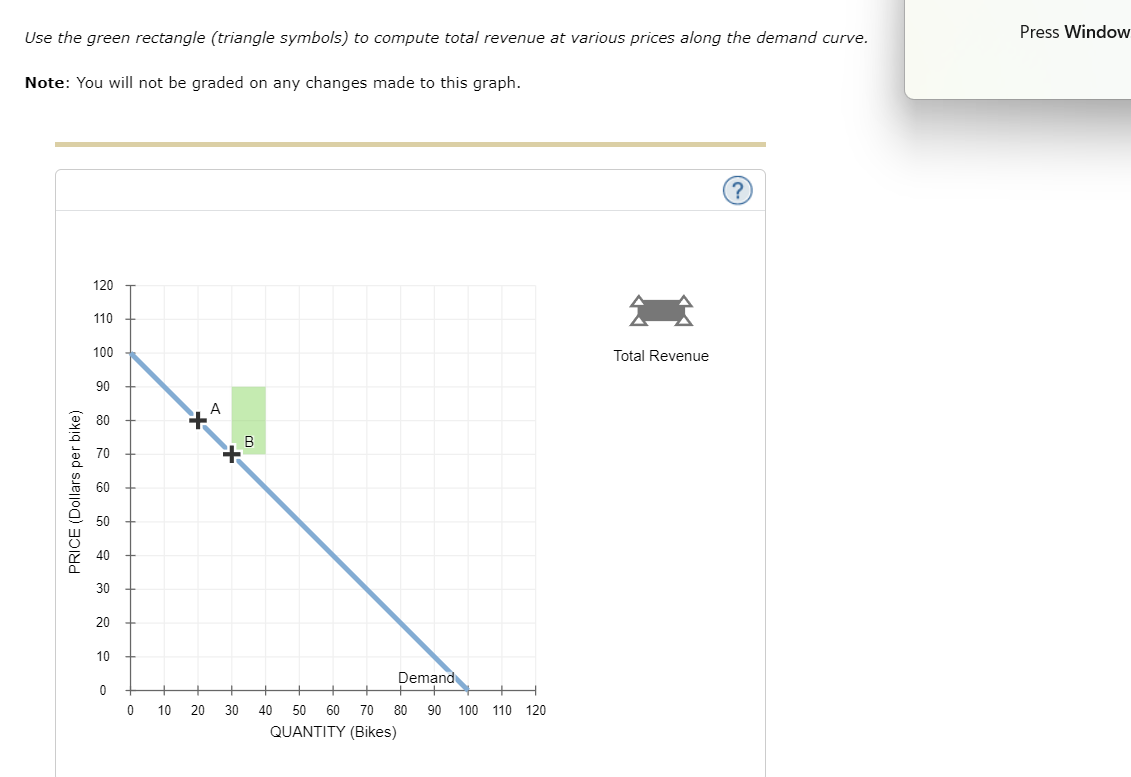


Press Window Use the green rectangle (triangle symbols) to compute total revenue at various prices along the demand curve. Note: You will not be graded on any changes made to this graph. 120 110 Total Revenue 100 90 A 80 B PRICE (Dollars per bike) 50 40 30 20 10 Demand 0 10 20 30 40 50 60 70 80 90 100 110 120 QUANTITY (Bikes)Module Three Quiz On the following graph, use the green point (triangle symbol) to plot the annual total revenue when the market price is $20, $30, $40, $50, $60, $70, and $80 per bike. 2860 A 2680 Total Revenue 2500 2320 U 2140 TOTAL REVENUE (Dollars) 1960 1780 1600 1420 1240 0 10 20 30 40 50 60 70 80 90 100 110 120 PRICE (Dollars per bike) According to the midpoint method, the price elasticity of demand between points A and B is approximately AlexAccording to the midpoint method, the price elasticity of demand between points A and B is approximately V . Suppose the price of bikes is currently $30 per bike, shown as point A on the initial graph. Because the demand between points A and B is V , a $10perbike decrease in price will lead to V in total revenue per day. In general, in order for a price increase to cause a decrease in total revenue, demand must be V
Step by Step Solution
There are 3 Steps involved in it

Get step-by-step solutions from verified subject matter experts