

Question: Preview Your objective is to develop a simple payroll spreadsheet application for the employees of a French bakery. Background: Jack and his wife Susan own
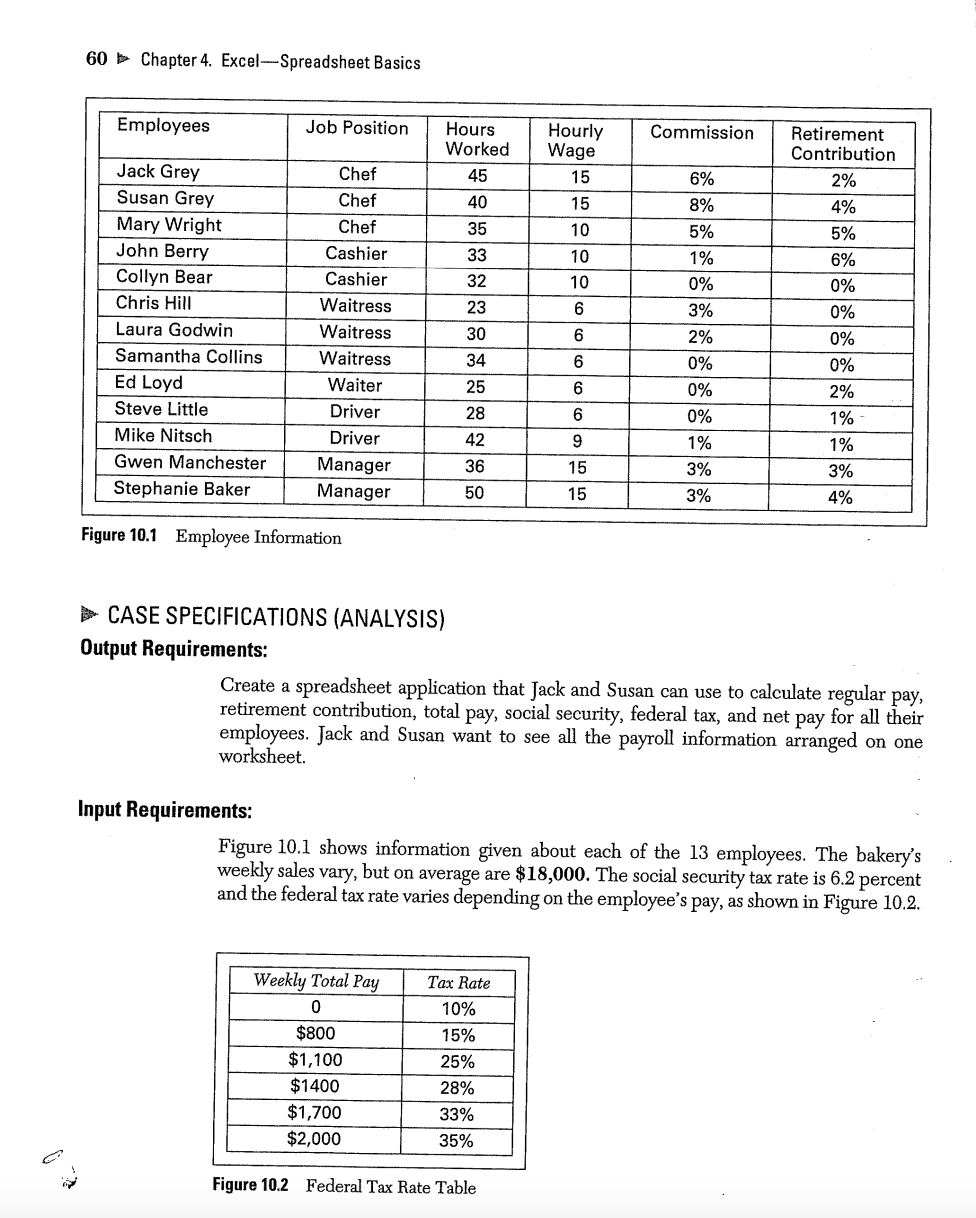
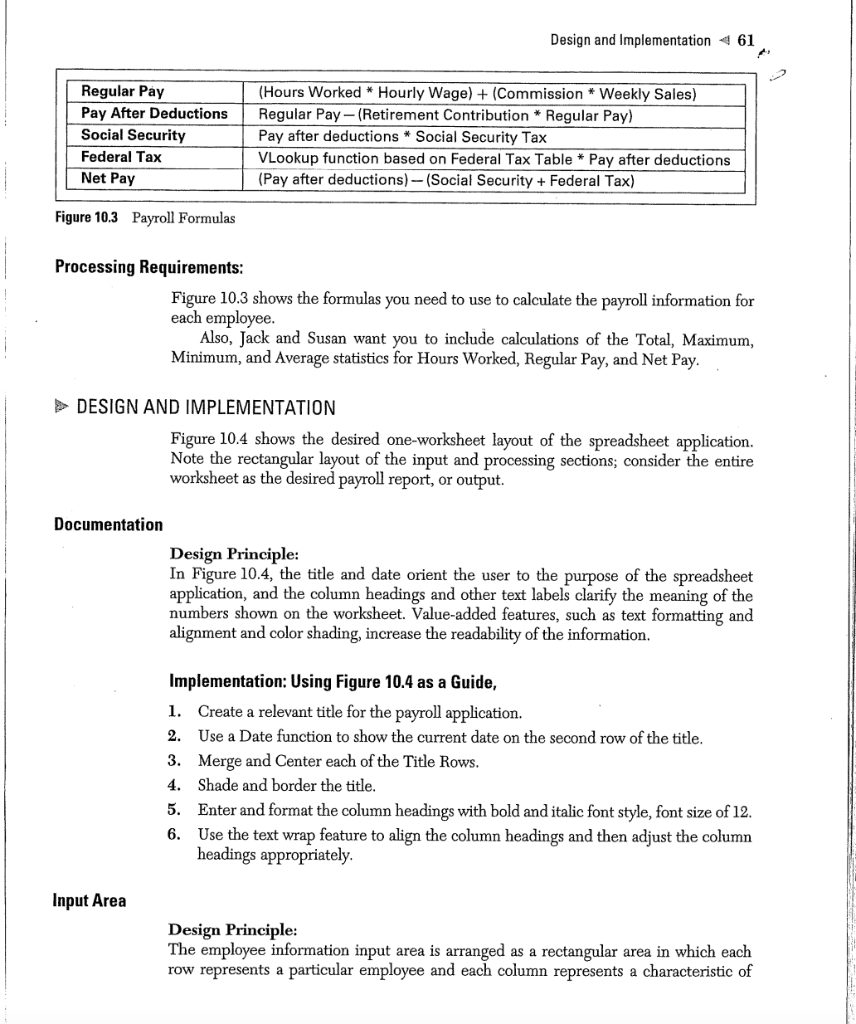
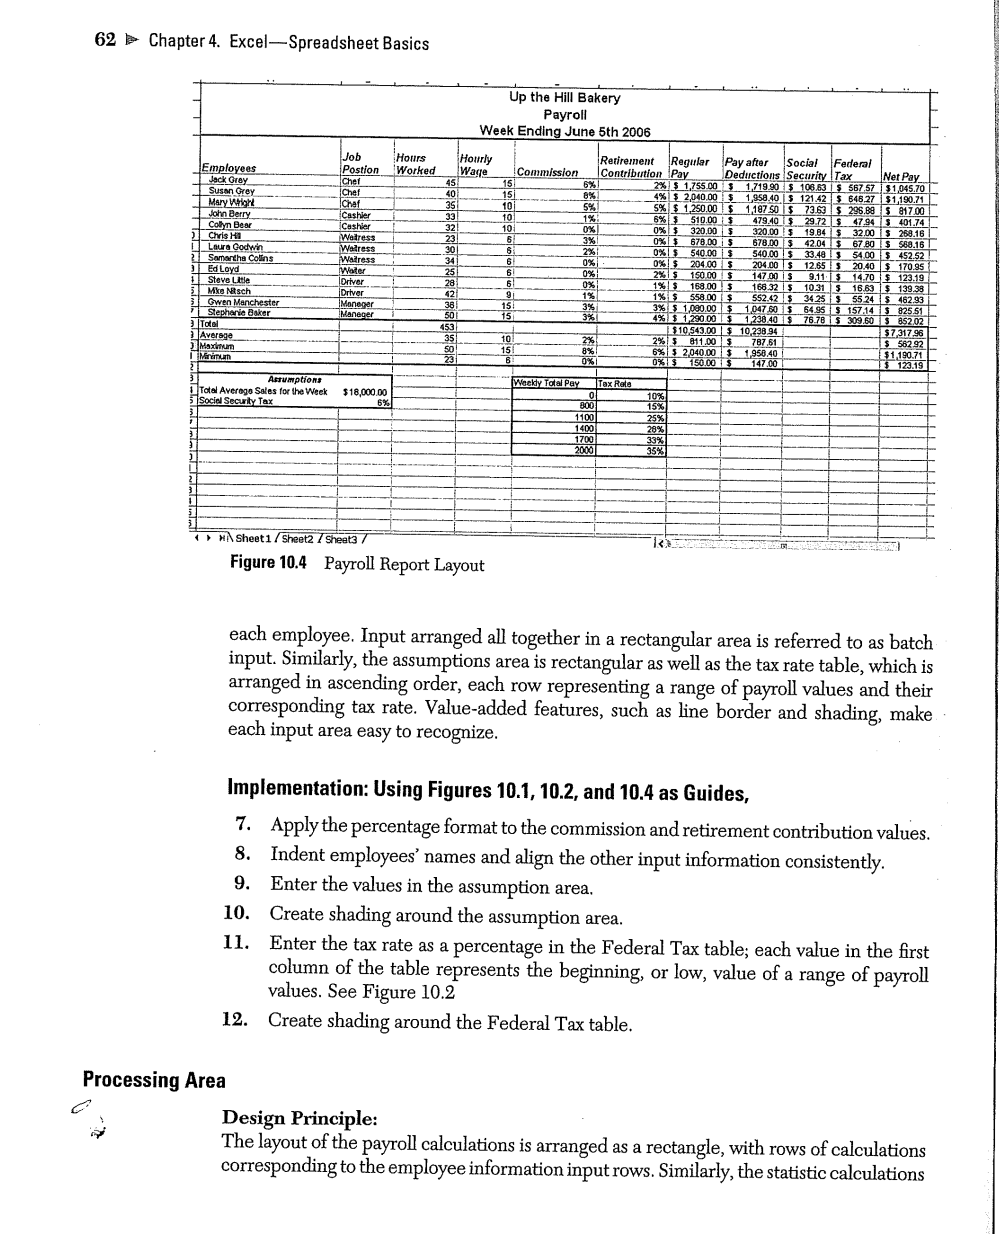
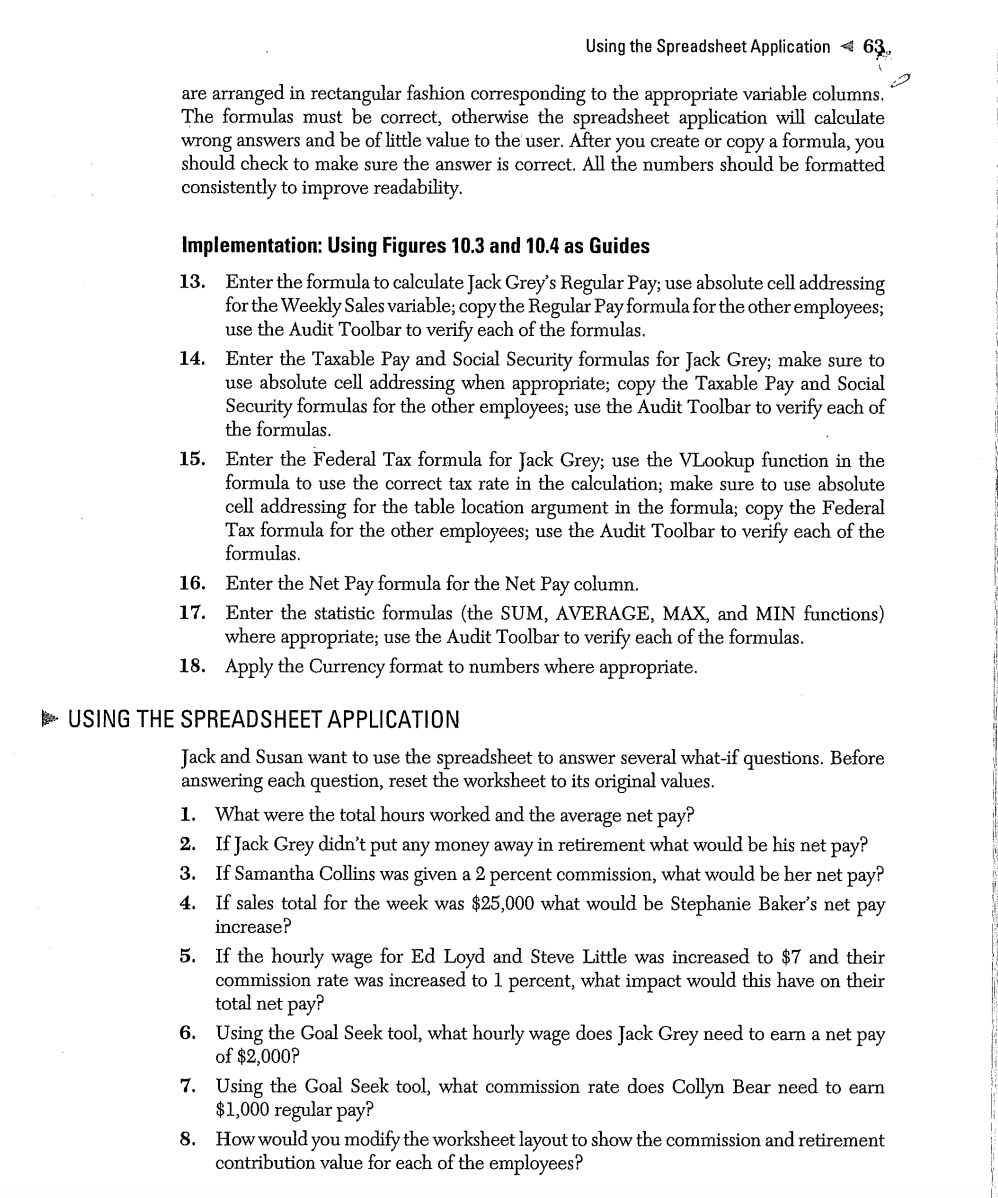

Preview Your objective is to develop a simple payroll spreadsheet application for the employees of a French bakery. Background: Jack and his wife Susan own a small French bakery in Chula Vista, California. This very popular bakery has a reputation for being the best in the business. Jack and Susan's customers are local residents and small restaurants around the city. Their store delivers fresh bread and pastries to their customers; they also serve breakfast and lunch in the store. Jack and Susan have 13 employees. Each employee earns an hourly wage and a commission on total weekly sales. The employees also have the option to invest in a pre-tax retirement account where they may designate a percentage of their earnings to be put aside for retirement. The Case Specifications provides you with all the information you need to get started. 60 Chapter 4. Excel-Spreadsheet Basics Figure 10.1 Employee Information CASE SPECIFICATIONS (ANALYSIS) Output Requirements: Create a spreadsheet application that Jack and Susan can use to calculate regular pay, retirement contribution, total pay, social security, federal tax, and net pay for all their employees. Jack and Susan want to see all the payroll information arranged on one worksheet. Input Requirements: Figure 10.1 shows information given about each of the 13 employees. The bakery's weekly sales vary, but on average are $18,000. The social security tax rate is 6.2 percent and the federal tax rate varies depending on the employee's pay, as shown in Figure 10.2. Figure 10.2 Federal Tax Rate Table Design and Implementation \& 61 Figure 10.3 Payroll Formulas Processing Requirements: Figure 10.3 shows the formulas you need to use to calculate the payroll information for each employee. Also, Jack and Susan want you to include calculations of the Total, Maximum, Minimum, and Average statistics for Hours Worked, Regular Pay, and Net Pay. DESIGN AND IMPLEMENTATION Figure 10.4 shows the desired one-worksheet layout of the spreadsheet application. Note the rectangular layout of the input and processing sections; consider the entire worksheet as the desired payroll report, or output. Documentation Design Principle: In Figure 10.4, the title and date orient the user to the purpose of the spreadsheet application, and the column headings and other text labels clarify the meaning of the numbers shown on the worksheet. Value-added features, such as text formatting and alignment and color shading, increase the readability of the information. Implementation: Using Figure 10.4 as a Guide, 1. Create a relevant title for the payroll application. 2. Use a Date function to show the current date on the second row of the title. 3. Merge and Center each of the Title Rows. 4. Shade and border the title. 5. Enter and format the column headings with bold and italic font style, font size of 12 . 6. Use the text wrap feature to align the column headings and then adjust the column headings appropriately. Input Area Design Principle: The employee information input area is arranged as a rectangular area in which each row represents a particular employee and each column represents a characteristic of 62 Chapter 4. Excel-Spreadsheet Basics Figure 10.4 Payroll Report Layout each employee. Input arranged all together in a rectangular area is referred to as batch input. Similarly, the assumptions area is rectangular as well as the tax rate table, which is arranged in ascending order, each row representing a range of payroll values and their corresponding tax rate. Value-added features, such as line border and shading, make each input area easy to recognize. Implementation: Using Figures 10.1, 10.2, and 10.4 as Guides, 7. Apply the percentage format to the commission and retirement contribution values. 8. Indent employees' names and align the other input information consistently. 9. Enter the values in the assumption area. 10. Create shading around the assumption area. 11. Enter the tax rate as a percentage in the Federal Tax table; each value in the first column of the table represents the beginning, or low, value of a range of payroll values. See Figure 10.2 12. Create shading around the Federal Tax table. Processing Area Design Principle: The layout of the payroll calculations is arranged as a rectangle, with rows of calculations corresponding to the employee information input rows. Similarly, the statistic calculations are arranged in rectangular fashion corresponding to the appropriate variable columns. The formulas must be correct, otherwise the spreadsheet application will calculate wrong answers and be of little value to the user. After you create or copy a formula, you should check to make sure the answer is correct. All the numbers should be formatted consistently to improve readability. Implementation: Using Figures 10.3 and 10.4 as Guides 13. Enter the formula to calculate Jack Grey's Regular Pay; use absolute cell addressing for the Weekly Sales variable; copy the Regular Pay formula for the other employees; use the Audit Toolbar to verify each of the formulas. 14. Enter the Taxable Pay and Social Security formulas for Jack Grey; make sure to use absolute cell addressing when appropriate; copy the Taxable Pay and Social Security formulas for the other employees; use the Audit Toolbar to verify each of the formulas. 15. Enter the Federal Tax formula for Jack Grey; use the VLookup function in the formula to use the correct tax rate in the calculation; make sure to use absolute cell addressing for the table location argument in the formula; copy the Federal Tax formula for the other employees; use the Audit Toolbar to verify each of the formulas. 16. Enter the Net Pay formula for the Net Pay column. 17. Enter the statistic formulas (the SUM, AVERAGE, MAX, and MIN functions) where appropriate; use the Audit Toolbar to verify each of the formulas. 18. Apply the Currency format to numbers where appropriate. USING THE SPREADSHEET APPLICATION Jack and Susan want to use the spreadsheet to answer several what-if questions. Before answering each question, reset the worksheet to its original values. 1. What were the total hours worked and the average net pay? 2. If Jack Grey didn't put any money away in retirement what would be his net pay? 3. If Samantha Collins was given a 2 percent commission, what would be her net pay? 4. If sales total for the week was $25,000 what would be Stephanie Baker's net pay increase? 5. If the hourly wage for Ed Loyd and Steve Little was increased to $7 and their commission rate was increased to 1 percent, what impact would this have on their total net pay? 6. Using the Goal Seek tool, what hourly wage does Jack Grey need to earn a net pay of $2,000 ? 7. Using the Goal Seek tool, what commission rate does Collyn Bear need to earn $1,000 regular pay? 8. How would you modify the worksheet layout to show the commission and retirement contribution value for each of the employees? BEYOND THE BASICS 9. Using the Subtotals Tool, what is the subtotal of the chef's Net Pay? (Use the Help function if you don't know how to use the subtotals tool.) 10. Using Subtotals Tool, what are the total hours the cashiers worked? 11. What should Up the Hill Bakery do to motivate its staff/workers? 12. What generic strategy (Porter's) would you recommend for Up the Hill Bakery? 13. What IT systems/applications can this bakery use to connect to its customers and suppliers? 14. What IT systems/applications can this bakery use to optimize its production processes? Explain. 15. To prevent threats to customer data, what advice would you offer Up the Hill Bakery? Preview Your objective is to develop a simple payroll spreadsheet application for the employees of a French bakery. Background: Jack and his wife Susan own a small French bakery in Chula Vista, California. This very popular bakery has a reputation for being the best in the business. Jack and Susan's customers are local residents and small restaurants around the city. Their store delivers fresh bread and pastries to their customers; they also serve breakfast and lunch in the store. Jack and Susan have 13 employees. Each employee earns an hourly wage and a commission on total weekly sales. The employees also have the option to invest in a pre-tax retirement account where they may designate a percentage of their earnings to be put aside for retirement. The Case Specifications provides you with all the information you need to get started. 60 Chapter 4. Excel-Spreadsheet Basics Figure 10.1 Employee Information CASE SPECIFICATIONS (ANALYSIS) Output Requirements: Create a spreadsheet application that Jack and Susan can use to calculate regular pay, retirement contribution, total pay, social security, federal tax, and net pay for all their employees. Jack and Susan want to see all the payroll information arranged on one worksheet. Input Requirements: Figure 10.1 shows information given about each of the 13 employees. The bakery's weekly sales vary, but on average are $18,000. The social security tax rate is 6.2 percent and the federal tax rate varies depending on the employee's pay, as shown in Figure 10.2. Figure 10.2 Federal Tax Rate Table Design and Implementation \& 61 Figure 10.3 Payroll Formulas Processing Requirements: Figure 10.3 shows the formulas you need to use to calculate the payroll information for each employee. Also, Jack and Susan want you to include calculations of the Total, Maximum, Minimum, and Average statistics for Hours Worked, Regular Pay, and Net Pay. DESIGN AND IMPLEMENTATION Figure 10.4 shows the desired one-worksheet layout of the spreadsheet application. Note the rectangular layout of the input and processing sections; consider the entire worksheet as the desired payroll report, or output. Documentation Design Principle: In Figure 10.4, the title and date orient the user to the purpose of the spreadsheet application, and the column headings and other text labels clarify the meaning of the numbers shown on the worksheet. Value-added features, such as text formatting and alignment and color shading, increase the readability of the information. Implementation: Using Figure 10.4 as a Guide, 1. Create a relevant title for the payroll application. 2. Use a Date function to show the current date on the second row of the title. 3. Merge and Center each of the Title Rows. 4. Shade and border the title. 5. Enter and format the column headings with bold and italic font style, font size of 12 . 6. Use the text wrap feature to align the column headings and then adjust the column headings appropriately. Input Area Design Principle: The employee information input area is arranged as a rectangular area in which each row represents a particular employee and each column represents a characteristic of 62 Chapter 4. Excel-Spreadsheet Basics Figure 10.4 Payroll Report Layout each employee. Input arranged all together in a rectangular area is referred to as batch input. Similarly, the assumptions area is rectangular as well as the tax rate table, which is arranged in ascending order, each row representing a range of payroll values and their corresponding tax rate. Value-added features, such as line border and shading, make each input area easy to recognize. Implementation: Using Figures 10.1, 10.2, and 10.4 as Guides, 7. Apply the percentage format to the commission and retirement contribution values. 8. Indent employees' names and align the other input information consistently. 9. Enter the values in the assumption area. 10. Create shading around the assumption area. 11. Enter the tax rate as a percentage in the Federal Tax table; each value in the first column of the table represents the beginning, or low, value of a range of payroll values. See Figure 10.2 12. Create shading around the Federal Tax table. Processing Area Design Principle: The layout of the payroll calculations is arranged as a rectangle, with rows of calculations corresponding to the employee information input rows. Similarly, the statistic calculations are arranged in rectangular fashion corresponding to the appropriate variable columns. The formulas must be correct, otherwise the spreadsheet application will calculate wrong answers and be of little value to the user. After you create or copy a formula, you should check to make sure the answer is correct. All the numbers should be formatted consistently to improve readability. Implementation: Using Figures 10.3 and 10.4 as Guides 13. Enter the formula to calculate Jack Grey's Regular Pay; use absolute cell addressing for the Weekly Sales variable; copy the Regular Pay formula for the other employees; use the Audit Toolbar to verify each of the formulas. 14. Enter the Taxable Pay and Social Security formulas for Jack Grey; make sure to use absolute cell addressing when appropriate; copy the Taxable Pay and Social Security formulas for the other employees; use the Audit Toolbar to verify each of the formulas. 15. Enter the Federal Tax formula for Jack Grey; use the VLookup function in the formula to use the correct tax rate in the calculation; make sure to use absolute cell addressing for the table location argument in the formula; copy the Federal Tax formula for the other employees; use the Audit Toolbar to verify each of the formulas. 16. Enter the Net Pay formula for the Net Pay column. 17. Enter the statistic formulas (the SUM, AVERAGE, MAX, and MIN functions) where appropriate; use the Audit Toolbar to verify each of the formulas. 18. Apply the Currency format to numbers where appropriate. USING THE SPREADSHEET APPLICATION Jack and Susan want to use the spreadsheet to answer several what-if questions. Before answering each question, reset the worksheet to its original values. 1. What were the total hours worked and the average net pay? 2. If Jack Grey didn't put any money away in retirement what would be his net pay? 3. If Samantha Collins was given a 2 percent commission, what would be her net pay? 4. If sales total for the week was $25,000 what would be Stephanie Baker's net pay increase? 5. If the hourly wage for Ed Loyd and Steve Little was increased to $7 and their commission rate was increased to 1 percent, what impact would this have on their total net pay? 6. Using the Goal Seek tool, what hourly wage does Jack Grey need to earn a net pay of $2,000 ? 7. Using the Goal Seek tool, what commission rate does Collyn Bear need to earn $1,000 regular pay? 8. How would you modify the worksheet layout to show the commission and retirement contribution value for each of the employees? BEYOND THE BASICS 9. Using the Subtotals Tool, what is the subtotal of the chef's Net Pay? (Use the Help function if you don't know how to use the subtotals tool.) 10. Using Subtotals Tool, what are the total hours the cashiers worked? 11. What should Up the Hill Bakery do to motivate its staff/workers? 12. What generic strategy (Porter's) would you recommend for Up the Hill Bakery? 13. What IT systems/applications can this bakery use to connect to its customers and suppliers? 14. What IT systems/applications can this bakery use to optimize its production processes? Explain. 15. To prevent threats to customer data, what advice would you offer Up the Hill Bakery
Step by Step Solution
There are 3 Steps involved in it

Get step-by-step solutions from verified subject matter experts